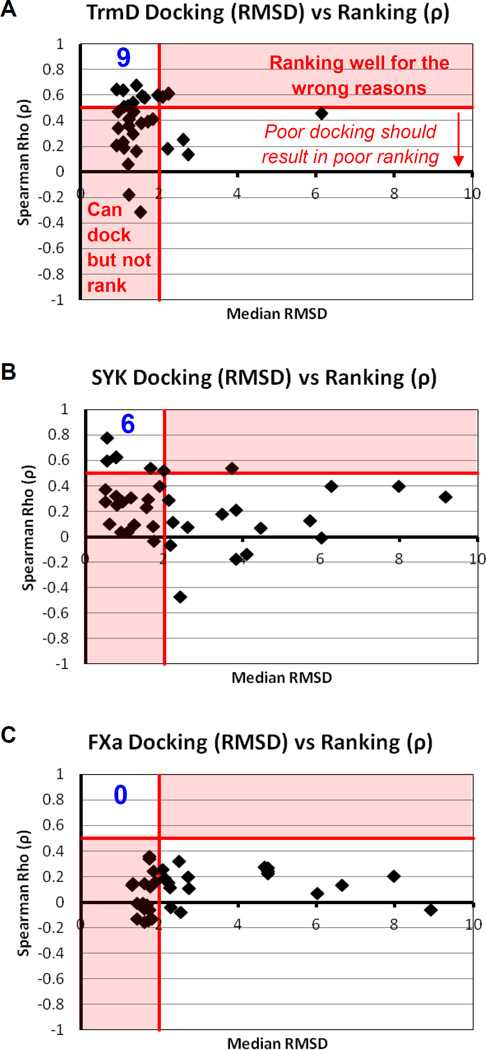
Figure 4.
Comparison of docking and ranking performance for each method submitted for Phase 2. The region in the upper left is the area where the most successful submissions are found. The value in blue is the number of methods with median RMSD ≤ 2 Å and ρ ≥ 0.5. Median ρ are calculated using all the unique ligands for each system. Median RMSD are calculated with the set of all Phase-2 ligands that have crystal structures.

