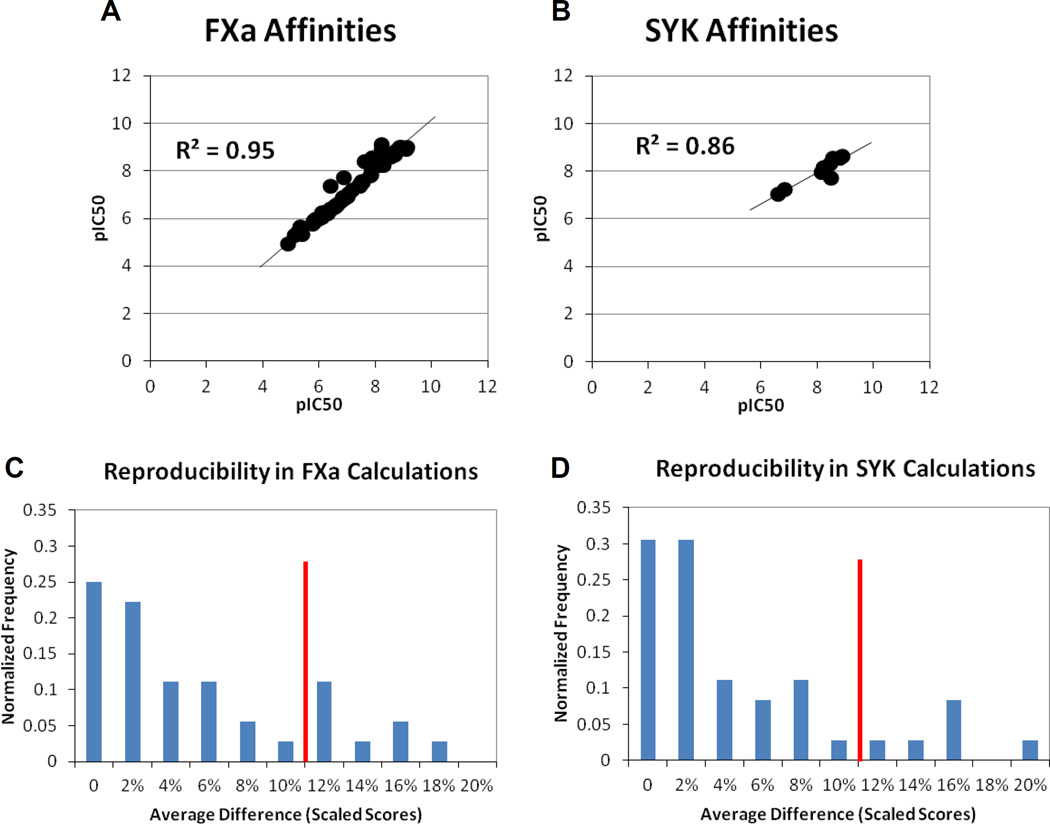
Figure 5.
There is very tight agreement in the IC50 data from different assays for FXa and different salt forms of SYK. (A) Across all the duplicate measurements for FXa, the average unsigned difference is 0.15 pIC50 and the standard deviation is only 0.24 pIC50. The slope is 1. (B) For SYK, the average unsigned difference is 0.27 pIC50 and the standard deviation is 0.21 pIC50. The slope deviates from 1.0, but the smaller range of data makes this less relevant. (C) For calculations of repeat FXa inhibitors, 9 methods produced the exact same scores/ranks for all the inhibitors. Another 20 methods had average differences less than 2σexpt (red line). (D) For calculations of SYK repeats, 11 methods gave the same scores/ranks, and 23 other methods had average differences less than 2σexpt (red line).

