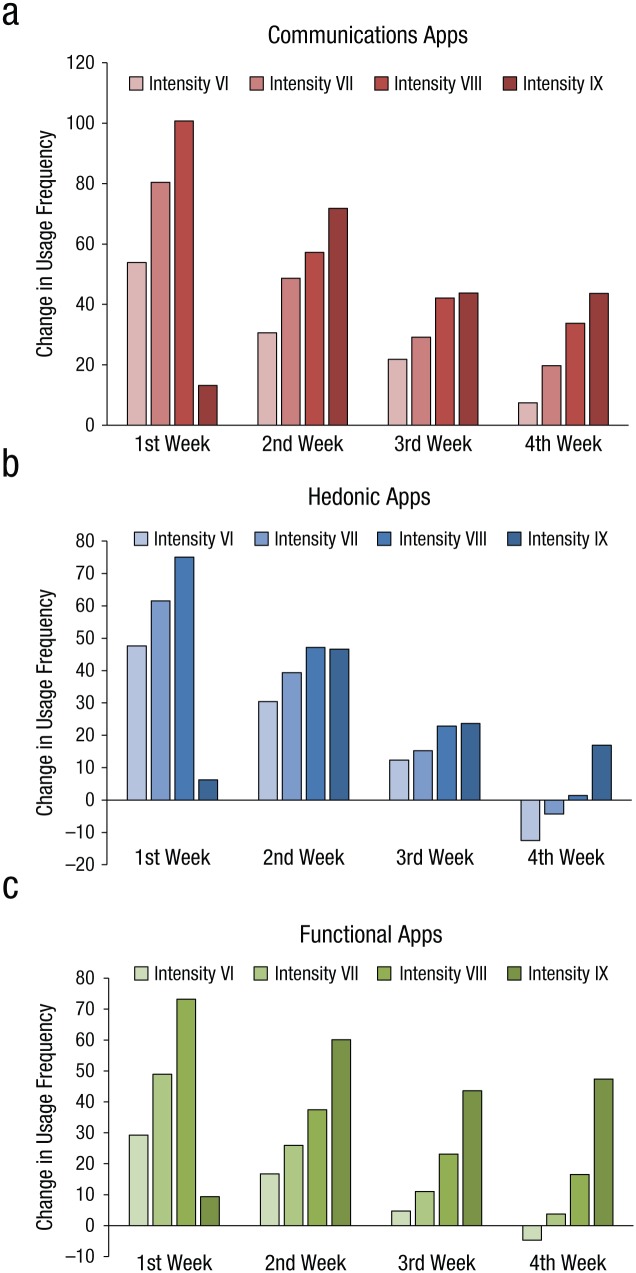
Fig. 1.
Change in weekly usage frequency of (a) communications, (b) hedonic, and (c) functional apps for the 4 weeks after the earthquake. Usage during the week before the earthquake was the baseline. Results are shown separately for locales that experienced earthquake intensities of VI, VII, VIII, and XIII. Because very few samples came from intensity V locales, these samples were included in the results for intensity VI.

