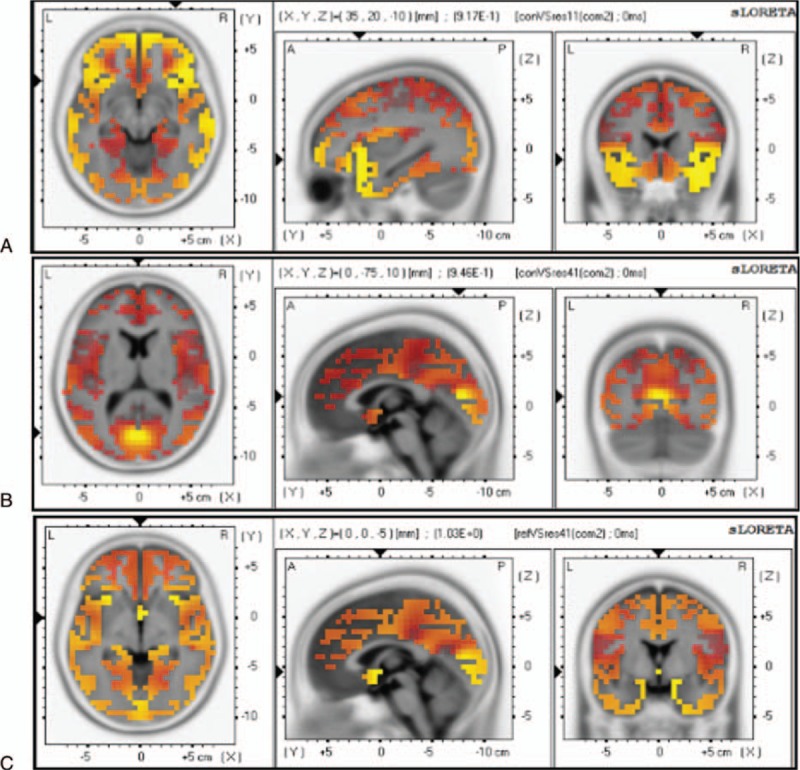
Figure 5.

sLORETA images focusing on the largest difference observed between the healthy controls and the OCD patients in the visual search (Experiment I). Yellow-Red indicates the activated areas between the two groups and presents the voxel with the most significant sLORETA values. (A) Inferior frontal gyrus (x, y, z = 35, 20, −10; BA = 47). (B) Occipital lobe (x, y, z = 0, −75, 10; BA = 18). (C) Anterior cingulate (x, y, z = 0, 0, −5; BA = 25). P < 0.05. OCD = obsessive-compulsive disorder, sLORETA = standard low-resolution electromagnetic tomography.
