
Figure 2.
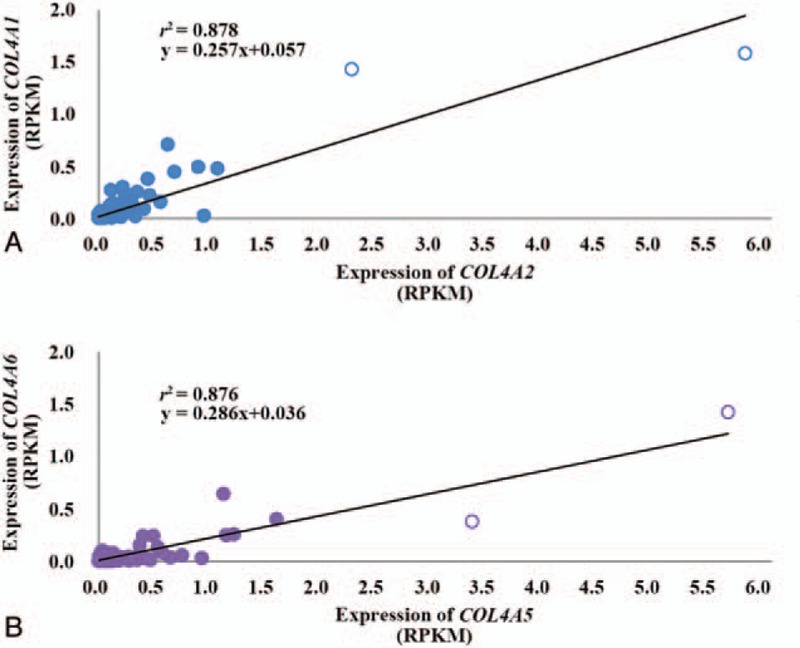
Correlation of expression between COL4A1 and COL4A2 (A), between COL4A5 and COL4A6 (B) in European lymphoblastoid cell lines. Unfilled circles indicate individuals with expression greater than 2 standard deviations of reads per kilobase per million mapped reads (RPKM).