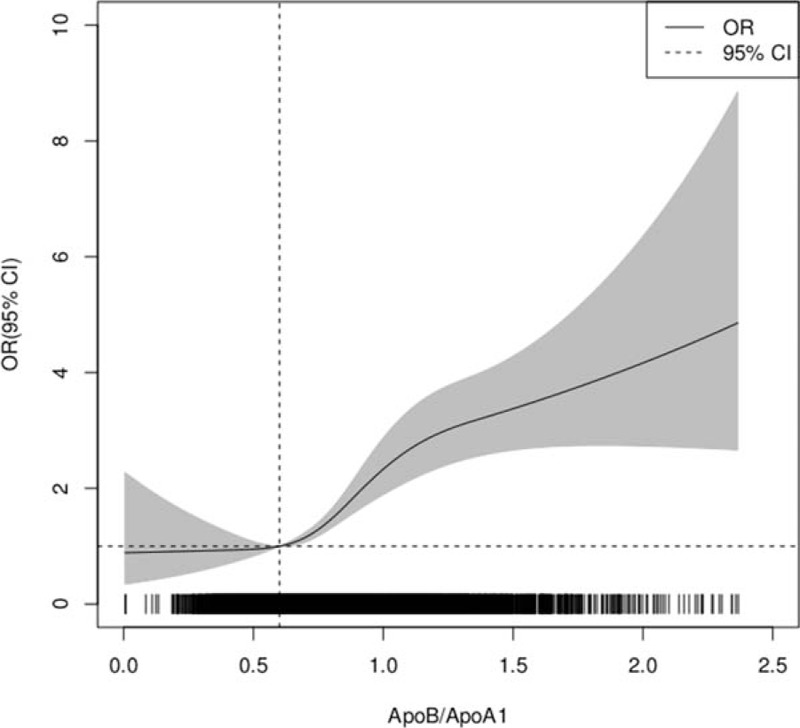
Figure 1.

The association between ApoB/ApoA1 with type 2 diabetes. The solid line indicates the odds ratio with gray shaded area meaning 95% confidence interval. The bottom black bar shows the cluster of participants in the range of ApoB/ApoA1 ratio (most participants are in the range of 0.2–2.0 for ApoB/ApoA ratio).
