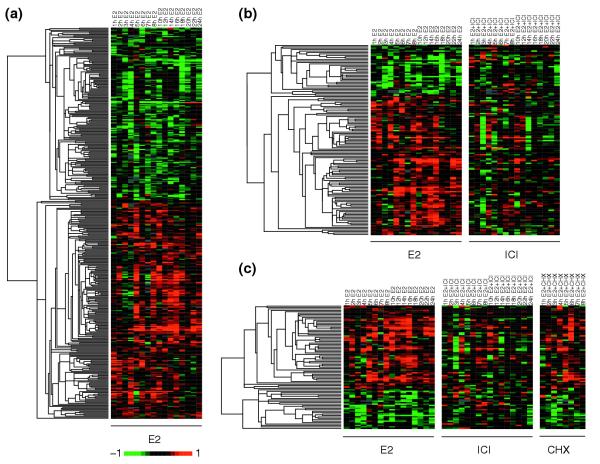
Figure 2.

Expression profiles of estrogen-responsive genes. (a) The 386 genes responsive to E2 were visualized by hierarchical clustering and the Eisen TreeView software. The columns represent time points arranged in chronological order, and each row represents the expression profile of a particular gene. By convention, upregulation is indicated by a red signal and downregulation by green. The magnitude of change is proportional to the brightness of the signal. Each panel represents a treatment condition as noted in the column headings. (b) ICI and (c) CHX treatments were included to identify the 137 ER-regulated genes and 89 primary response genes, respectively.
