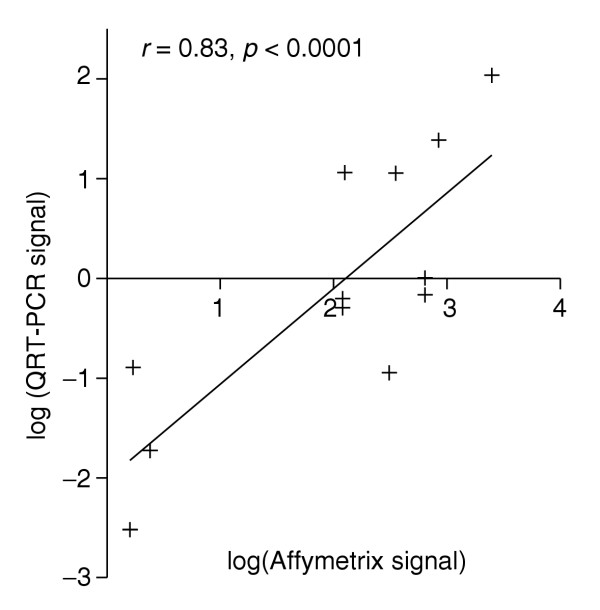
Figure 2.

Semi-quantitative inter-gene comparison is possible using Affymetrix signal. The 24 QRT-PCR results underlying Table 3 were normalized against rp49, and plotted against the Affymetrix signal globally normalized as in MAS 5.0. Spearman's r was calculated, and significance of the correlation assessed (one-tailed), using Graphpad Prism 3.0.
