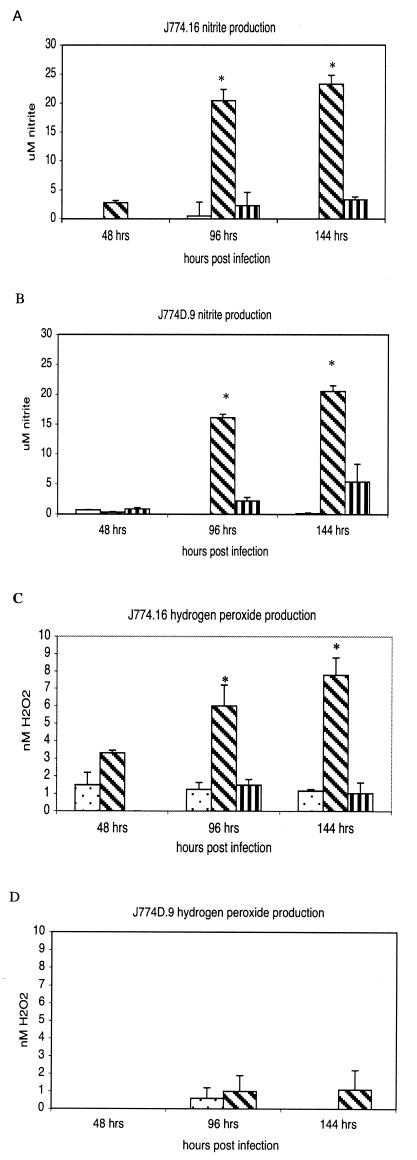
FIG. 2.
Nitrite and hydrogen peroxide levels in J774.16 and J774D.9 cells. The cells were infected for 24 h with virulent phase I C. burnetii and then were treated with 100 U of murine rIFN-γ/ml in thepresence or absence of the iNOS inhibitor NMMLA (1 mM) or the hydrogen peroxide scavenger catalase (100 μM). The stimulation of iNOS was indirectly determined by measuring nitrite, which is a stable end product of nitric oxide production. Hydrogen peroxide levels were determined by measuring the horseradish peroxidase-dependent oxidation of phenol red. (A) Nitrite levels in J774.16 cells. (B) Nitrite levels in J774D.9 cells. (C) Hydrogen peroxide levels in J774.16 cells. (D) Hydrogen peroxide levels in J774D.9 cells. (A and B) Stippled bars, no treatment; diagonally striped bars, treatment with 100 U of IFN-γ/ml; vertically striped bars, treatment with 100 U of IFN-γ/ml and 1 mM NMMLA. (C) Stippled bars, no treatment; diagonally striped bars, treatment with 100 U of IFN-γ/ml; vertically striped bars, treatment with 100 U of IFN-γ/ml and 100 μM catalase. (D) Stippled bars, no treatment; diagonally striped bars, treatment with 100 U of IFN-γ/ml. The results are expressed as means and standard errors for three replicates from two independent experiments. Asterisks indicate significant differences between treated and untreated samples within the same time points.

