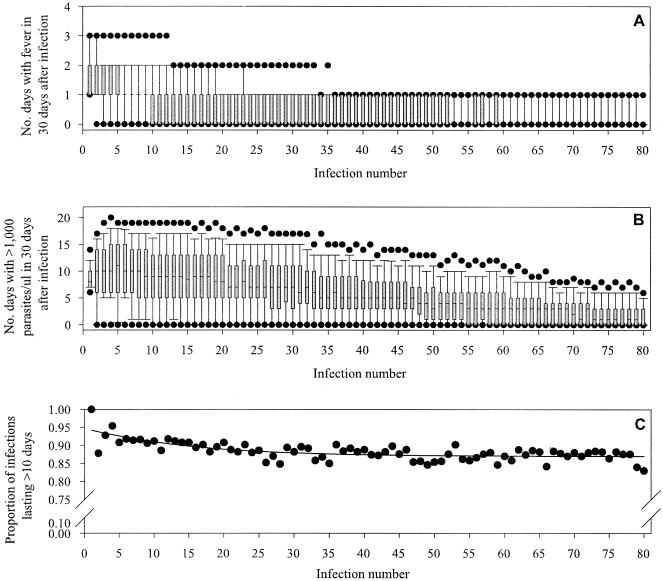
FIG. 2.
Sample of output from 500 simulations with an infection approximately every 60 days and a population of 1,000 var genes. A) Number of fever occurrences, B) number of days with parasite density of >1,000/μl, and C) proportion of infections that were successful as blood-stage infections lasting more than 10 days. Shaded regions in A and B represent the interquartile range of the simulated data; dots represent the 5th and 95th percentiles. In C, the line represents the fitted regression model with an asymptote of 0.87.

