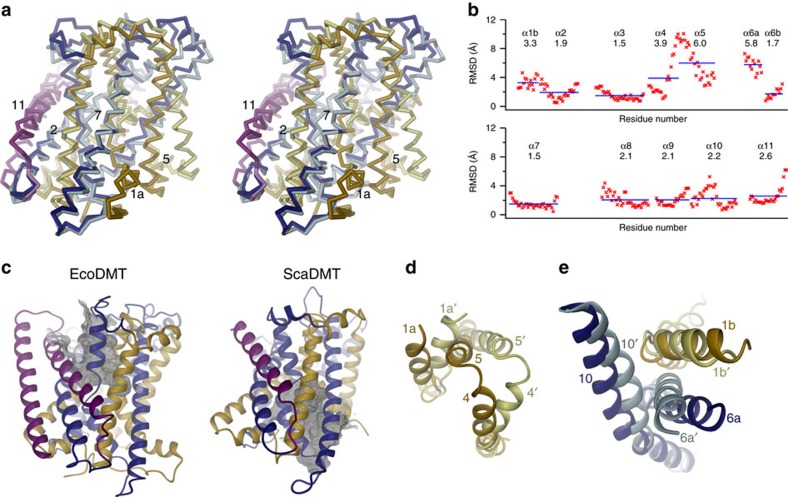
Figure 3. Comparison of EcoDMT and ScaDMT.
(a) Stereo view of a superposition of EcoDMT and ScaDMT (PDB ID 5M94). The proteins are shown as Cα-traces. Perspective and colour-coding of EcoDMT are as in Fig. 2a (right panel). For ScaDMT, the N-terminal domain is coloured in yellow, the C-terminal domain in light blue and α-helix 11 in pink. (b) RMSD of Cα positions calculated from a least-square superposition of equivalent regions of ScaDMT and EcoDMT. The residue number is plotted on the x-axis. Blue lines and numbers show averages for each transmembrane segment. (c) Aqueous cavities leading to the metal binding sites of EcoDMT (left) and ScaDMT (right). Proteins are coloured as in Fig. 2 and shown as ribbons. The view is approximately as in the left panel of Fig. 2a. Parts of the molecular surface showing the access cavities are shown as dense grey mesh. Movements in an outward to inward transition regulating the opening of the intracellular cavity (d) and the closing of the extracellular cavity (e). In d the view is from the intra- and in e from the extracellular side along an axis perpendicular to the membrane. Parts of the EcoDMT and ScaDMT structures are shown as ribbons and coloured as in a. The position of α-helix 1a in the ScaDMT structure was modelled on an intermediate position based on the corresponding region in the inward-facing structures of LeuT (PDB ID 3TT3) and vSGLT (PDB ID 3DH4) (Supplementary Fig. 4c).

