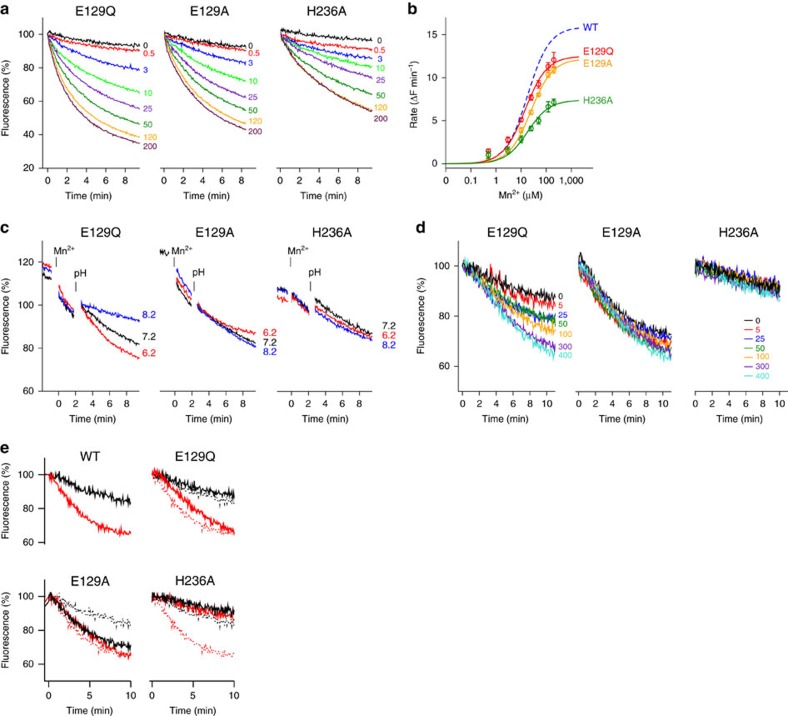
Figure 6. Functional properties of mutants of potential H+ acceptors.
(a) Mn2+ transport into proteoliposomes containing the EcoDMT mutants E129Q (left), E129A (center) and H236A (right). Experiments were carried out at pH 7.2. Traces are shown in unique colours with outside Mn2+ concentrations (μM) indicated. (b) Mn2+ concentration dependence of transport in the mutants E129Q, E129A and H236A. The solid lines show fits to a Michaelis-Menten equation (E129Q, KM 14.4 μM, vmax 12.5 ΔF min−1; E129A, KM 24.4 μM, vmax 12.2 ΔF min−1; H236A, KM 18.1 μM, vmax 7.4 ΔF min−1). WT (KM 18.2 μM, vmax 15.9 ΔF min−1) is shown for comparison. Data points represent mean and s.e.m. of 4–7, 5–10 and 3–6 technical replicates for E129Q, E129A and H236A, respectively. (c) pH dependence of transport into proteoliposomes containing mutants E129Q (left), E129A (center) and H236A (right). The experiment was carried out as described for Fig. 1c. (d) Mn2+-dependent transport of H+ into proteoliposomes containing the mutants E129Q (left), E129A (center) and H236A (right). Traces are shown in unique colours with outside Mn2+ concentrations (μM) indicated. (e) Comparison of the acidification of proteoliposomes at similar Mn2+ transport rates. Traces in the absence of Mn2+ are shown in black. In case of mutants, red traces correspond to a Mn2+ concentration of 300 μM, and in case of WT to 100 μM to account for its higher maximal activity. Data are from Figs 1d and 6d. Mutant panels show WT traces as dotted line for comparison.

