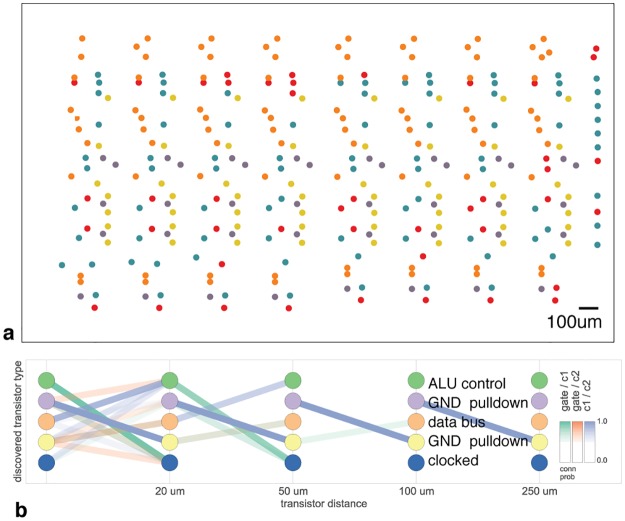
Fig 3. Discovering connectivity and cell type.
Reproduced from [31]. (A) The spatial distribution of the transistors in each cluster show a clear pattern (B) The clusters and connectivity versus distance for connections between Gate and C1, Gate and C2, and C1 and C2 terminals on a transistor. Purple and yellow types have a terminal pulled down to ground and mostly function as inverters. The blue types are clocked, stateful transistors, green control the ALU and orange control the special data bus (SDB).

