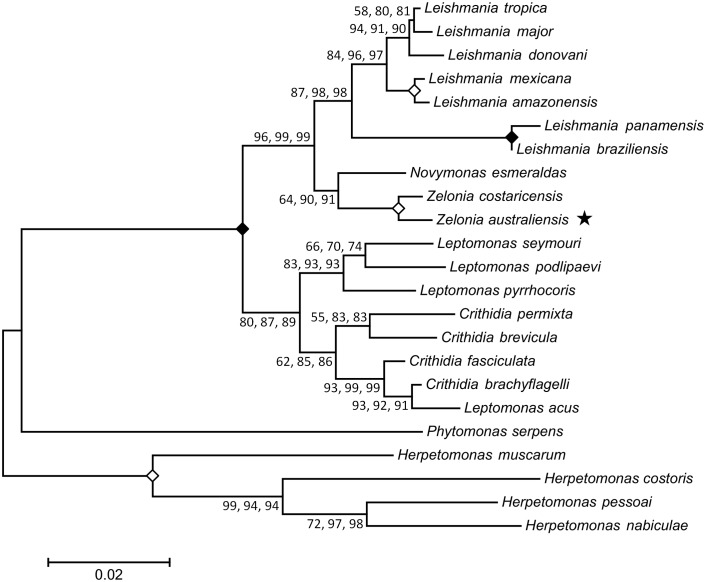
Fig 6. Inferred evolutionary relationship between Zelonia australiensis and other trypanosomatids using concatenated 18S rDNA and gGAPDH sequences.
This tree was constructed using sequences from 23 trypanosomatids, aligned to a total of 1302 positions with all gaps and missing data eliminated. The structure of this tree was inferred using three statistical methods; the ML method based on the Tamura-Nei model, the ME method [36] and the NJ method [37]. The same tree structure was predicted using each method. The first value at each node is the percentage of trees in which the associated taxa clustered together using the ML method (1000 replicates). The second and third number at each node is the percentage of replicate trees obtained for the ME and NJ methods respectively, in which the associated taxa clustered together in the bootstrap test (1000 replicates) [102]. A solid diamond indicates a node that obtained a value of 100% for all three methods. An open diamond indicates a node that obtained a value of at least 99% for each method. The star highlights the phylogenetic position of Z. australiensis. The bar represents the number of substitutions per site.

