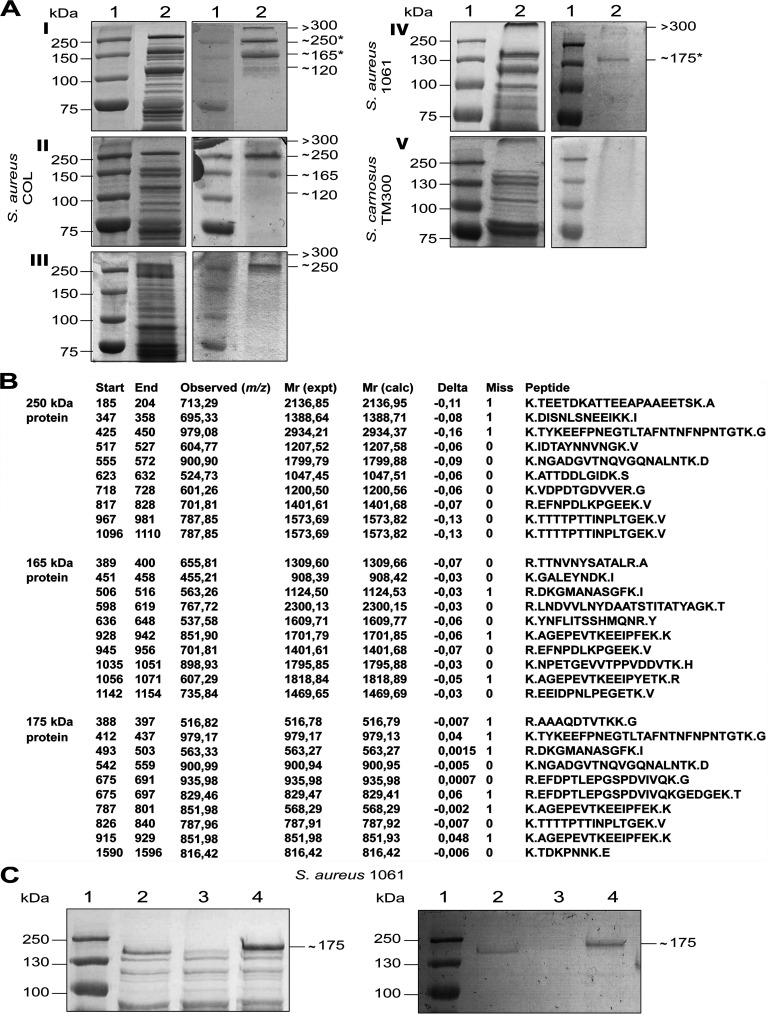
Fig 1. The S. aureus plasmin-sensitive protein Pls is a glycoprotein.
(A) For all samples, left panel are Coomassie-Blue stained gels (10% separation gel) corresponding to PAS staining (right panel) to detect glycosylated proteins. Lane 1, marker proteins; Lane 2, surface proteins from I, S. aureus COL, stationary phase; II, S. aureus COL, exponential phase, III, S. aureus COL surface-associated proteins; IV, S. aureus 1061, stationary phase; V, S. carnosus TM300 stationary phase. The stars indicate the proteins subjected to MS. (B) The 250-kDa, 165-kDa, and 175-kDa proteins were identified as Pls by MS. For each analysis, 10 detected peptides are given with their aa positions (Start, End), observed monoisotopic mass of the respective peptide in the spectrum [Observed (m/z)], experimental mass of the respective peptide calculated from the observed m/z value [Mr (expt)], theoretical mass of the respective peptide based on its sequence [Mr (calc)], difference between the theoretical Mr (calc) and experimental Mr (expt) masses [delta (Da)], number of missed trypsin cleavage sites (Miss) and peptide sequences (Peptide). The dots indicate trypsin cleavage sites. (C) SDS-PAGE (10% separation gel) (left) and corresponding PAS staining (right) of surface proteins from S. aureus 1061 (lane 2), S. aureus 1061pls (lane 3), and S. aureus 1061pls (pPLS4) (lane 4).

