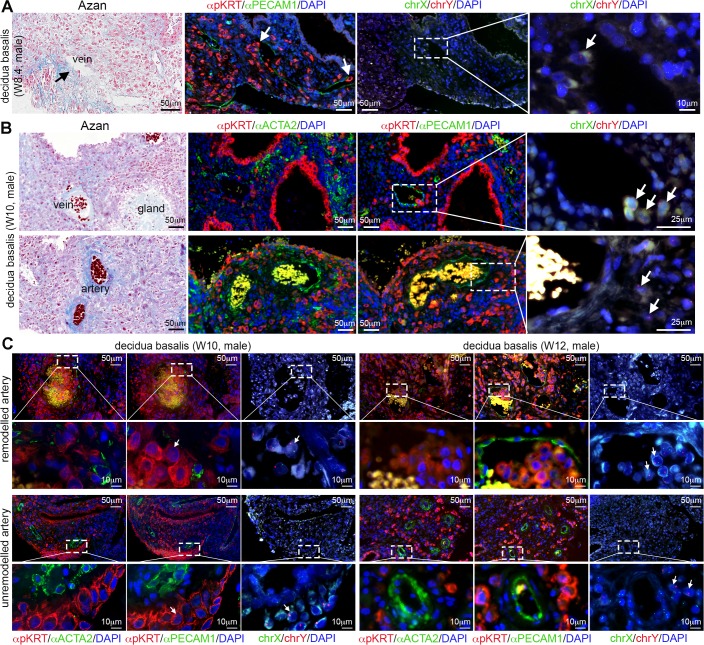
Fig 3. Human extravillous trophoblast cells in decidua between W8-W12.
(A) Histological sections of decidua basalis at W8.4 used for Azan staining (left panel), immunostained for pKRT and PECAM1 (left-middle panel). FISH for chrX/chrY (right panels) was performed in the pKRT/PECAM1-stained sections. The most right panel shows a magnification of the dashed box. White arrows indicate male EVTs invading veins. (B) Histological sections of decidua basalis at W10 used for Azan staining (left panel), immunostained for pKRT and ACTA2 (left-middle panel) and immunostained for pKRT and PECAM1 (right-middle panel). FISH for chrX/chrY (right) was performed in the pKRT/PECAM1-stained sections. White arrows indicate male EVTs. Low magnifications are shown in S2 Fig. (C) Histological sections of W10 and W12 decidua basalis showing remodeled and unremodelled arteries. Consecutive sections were immunostained for pKRT and ACTA2 (left panels) and immunostained for pKRT and PECAM1 (middle panels). FISH for chrX and chrY (right panels) was performed in the pKRT/PECAM1-stained sections. The bottom rows show magnifications of the dashed boxes in the top rows. All scale bars are depicted.

