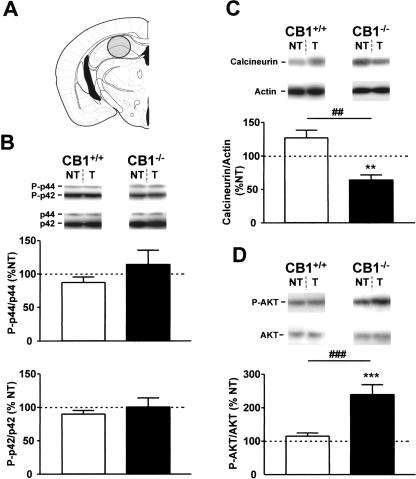
Figure 5.
Tone-induced activation of ERKs, calcineurin, and AKT in the dorsal hippocampus of CB1+/+ and CB1-/- mice. (A) Schematic drawing depicting the dissected area according to Paxinos and Franklin (2001). (B) Levels of phosphorylation of ERKs. (Photographs) Western immunoblots showing bands corresponding to phosphorylated forms of ERKs (P-p44 and P-p42) and to respective total ERK protein (p44 and p42). (Graphs) Densitometric quantification of tone-induced p44 ERK (top graph) and of p42 ERK (bottom graph) phosphorylation in CB1+/+ (open bars) and CB1-/- mice (filled bars), relative to respective no-tone mice (average: 100%, dotted line). (C) Levels of calcineurin expression. (Photographs) Western immunoblots showing bands corresponding to calcineurin and to respective actin. (Graph) Densitometric quantification of tone-induced calcineurin expression in CB1+/+ (open bars) and CB1-/- mice (filled bars), relative to respective no-tone mice (average: 100%, dotted line). (D) Levels of phosphorylation of AKT. (Photographs) Western immunoblots showing bands corresponding to phosphorylated form of AKT (P-AKT) and to respective total AKT protein (AKT). (Graph) Densitometric quantification of tone-induced AKT phosphorylation in CB1+/+ (open bars) and CB1-/- mice (filled bars), relative to respective no-tone mice (100%, dotted line). Data expression and symbols are as in Figure 2. (***) P < 0.001.

