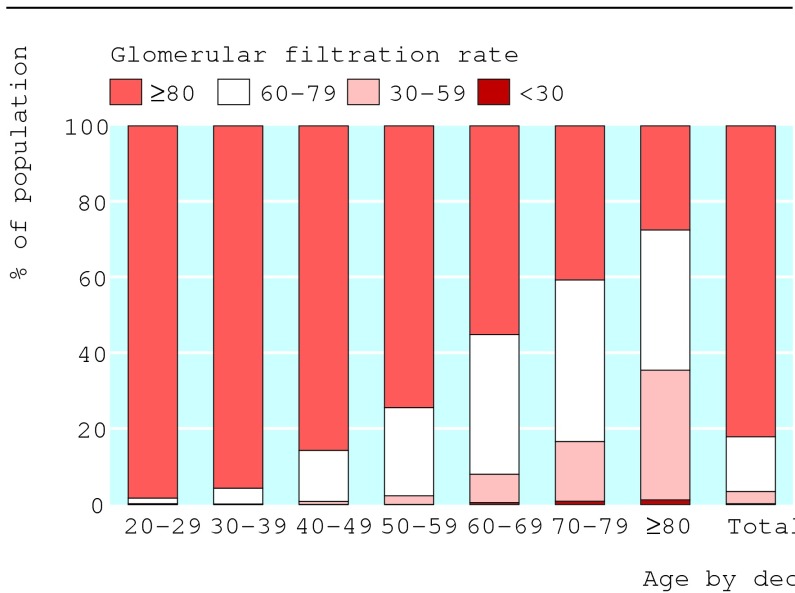
Figure 1.
Weighted distribution of predicted glomerular filtration rate by the modification of diet in renal diseases equation, by age (in decades), for non-diabetic adults in third national health and nutrition examination survey. (Estimates are calculated after subtraction of 20.3 μmol/l from serum creatinine concentration to account for differences between White Sands and Cleveland clinic laboratories). Values are given in ml/min/1.73 m2. Modified from Clase et al9

