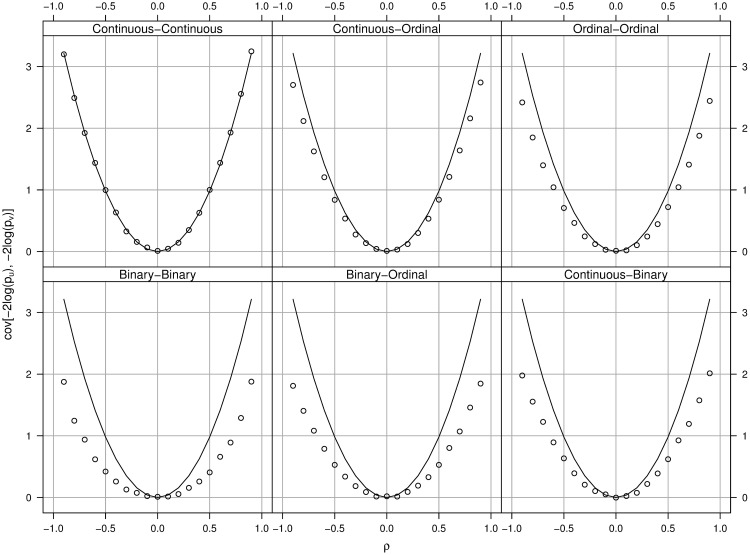
Fig 1. The relationship between the covariance cov[−2log(pu), −2log(pv)] and the correlation ρ.
The title in each panel indicates the types of data simulated. The solid curve in each panel corresponds to our covariance estimates using Eq (3). The dotted curves are the true covariances calculated from the simulated data.

