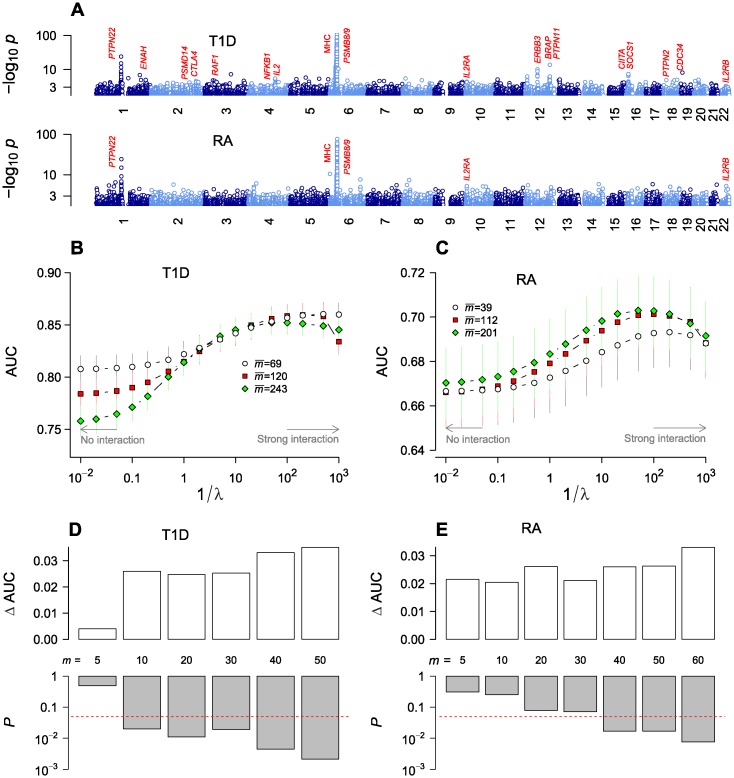
Fig 1. Genome-wide association of type 1 diabetes (T1D) and rheumatoid arthritis (RA) single-nucleotide polymorphisms (SNPs) under independent-SNP and collective inferences.
(A) Independent-SNP p-value profiles based on genotypic model. Note that the p-values are in “double logarithmic” scale for clarity. (B-C) Optimization of collective inference model parameters with cross-validation area under the curve (AUC) as a function of model sizes (mean number of SNPs selected) and inverse of penalizer 1/λ. The small and large-1/λ limits correspond to non-interacting and strongly interacting limits, respectively. Vertical bars are 95% c.i. (D-E) Statistical significance of the rise in AUC from interaction effects (ΔAUC; defined as the difference between the maximum AUC and the non-interacting limit). For T1D (D) and RA (E), the first m SNPs were selected from the sorted list with increasing order of single-SNP p-value pi, and the null distribution of ΔAUC was sampled by permutation of the phenotypic label to estimate the p-value (bottom; horizontal line represents p = 0.05) for the significance of the actual ΔAUC observed (top).

