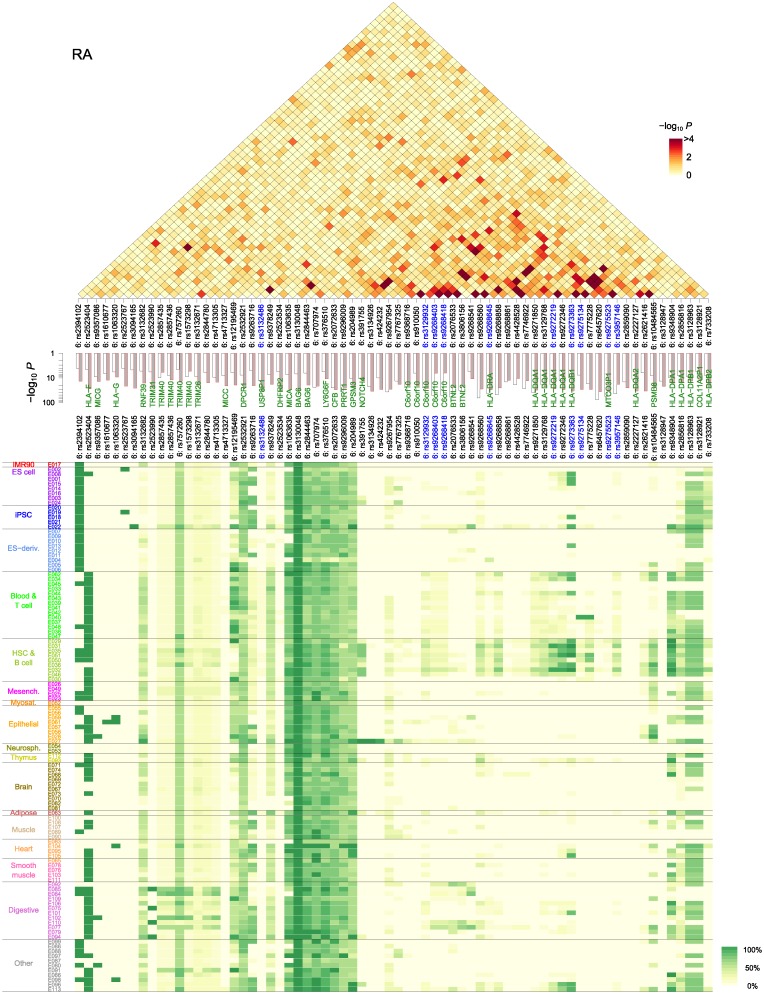
Fig 3. RA collective inference p-values and epigenetic activity distribution.
m = 70 proxy SNPs were selected based on pi values (middle, open bars) combined with clustering to reduce LD. The top (triangular) and middle (bar graph) panels show the interaction and (additive) single-SNP contributions, respectively. Bottom panel shows the mean frequencies of epigenetically active states as in Fig 2.

