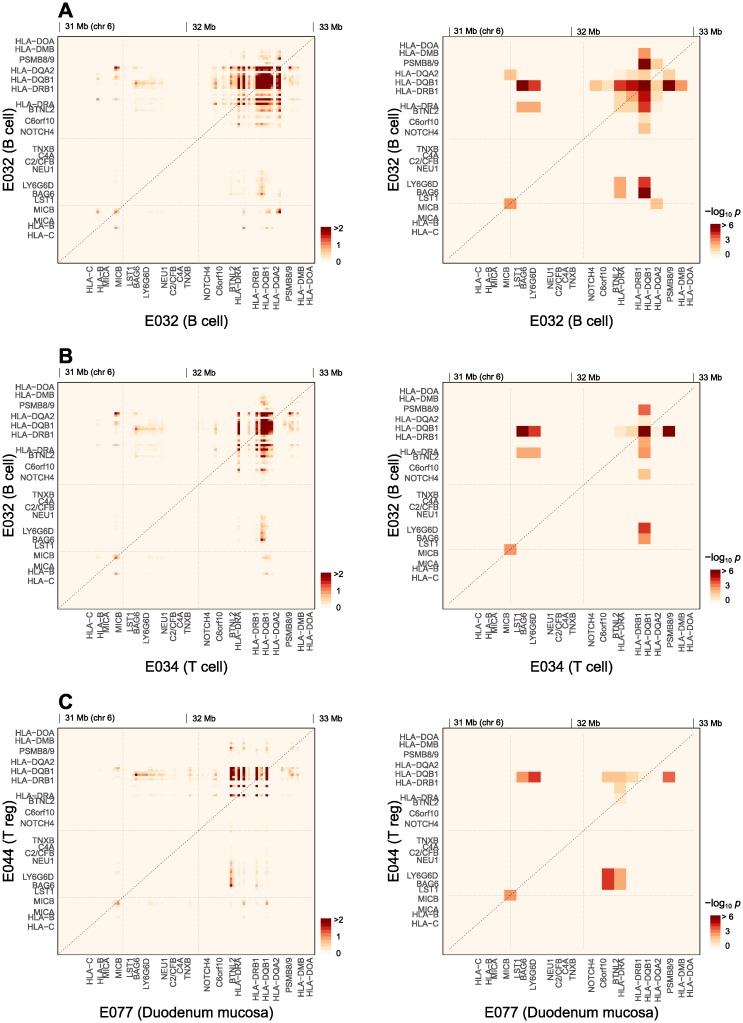
Fig 6. Spatial distribution of tissue-specific SNP-interactions for T1D.
The overall enrichment profiles of cell type combinations in Fig 4B were resolved into contributions from genetic regions within the MHC locus. (A) B cell:B cell, (B) B cell:T cell, and (C) Duodenum mucosa:Treg cell combinations. The left and right columns show the effective number of active SNP pairs (in a 20-kb grid) and the relative enrichment of this number within the given cell type combination against the total (in a 100-kb grid), respectively.

