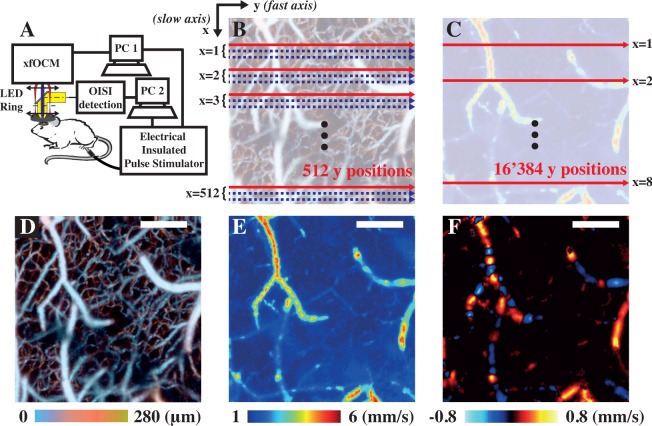
Fig. 1.
The xfOCM set-up was augmented with an OIS imaging module and an LED ring to localise the area of maximal response to stimulation (a). Two individual computers controlled the xfOCM and the OIS detection respectively and were both connected to a Pulse Stimulator to deliver the electrical pulses to the limb of interest. OCM angiograms, as shown in (d), were obtained by acquiring 3 passes along the slow axis at each lateral position (b). In contrast, total flow velocity images, as depicted in tile (e), were obtained by oversampling 32 times along the fast axis (c). During the functional imaging, the total blood flow velocity protocol was applied at selected lateral positions (highlighted by the red arrow in (c) and by yellow dashed line in the following figures) instead of all over the lateral field of view to increase the temporal resolution of the acquisitions. The differences between total flow and axial flow images are portrayed in tiles (e) & (f) respectively, where the orientation of the vessel leads to discontinuities and speed reversal in the axial but not in the total flow image. Moreover, the range of velocities between both tiles is also different, as in (e) the magnitude of the total velocity vector is shown whereas only the magnitude of its projection along the optical axis is shown in (f). Scalebars: 200 µm.

