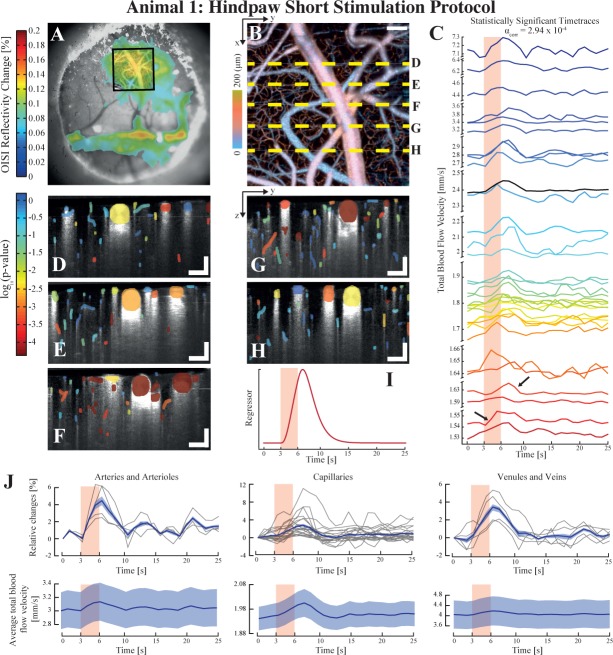
Fig. 3.
Assessment of the variability of the evoked response within different vascular compartments using the short protocol on animal 1. OISI imaging is first used to localise the area of maximal response to the electrical stimulation, here with a 5× objective (a). An angiogram is then obtained in OCM over a selected region (square in tile (a)) to reveal the vasculature (b). The total velocity timetraces which lead to a statistically significant result after GLM analysis are displayed in tile (c), demonstrating the inherent heterogeneity of the hemodynamic reactivity of vessels (the arrows indicate both fast and slow total blood flow responses). The statistical maps of the different lateral positions highlighted in (b) are shown in tiles (d) to (h), where the p-value is color coded. The regressor used to model the velocity response for the GLM analysis of this dataset is shown in tile (i). The significant timetraces were grouped according to their respective vascular compartment (arteries and arterioles, capillaries and venules and veins) and both their average relative changes and average blood velocity are plotted in tile (j). The shaded areas in (j) represent the standard error around the mean (in bold). Each individual relative change curve are plotted in light grey in the relative changed panel. Scalebars: 100 µm.

