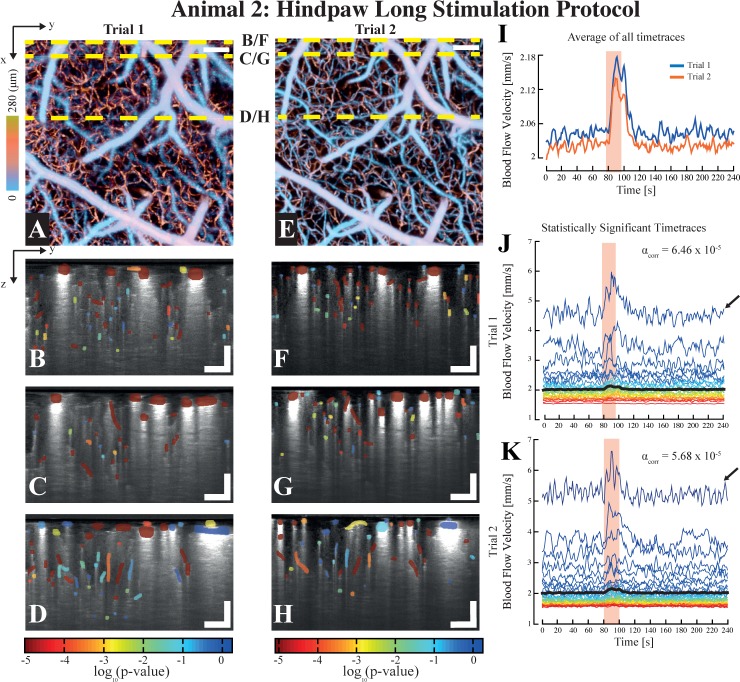
Fig. 4.
Assessment of the viability of SPM-OCM for longitudinal studies obtained by applying the long protocol on animal 2. The depth-coded angiograms for both trials are shown in tile (a) and (e) respectively, showing that the region interrogated in each trials was identical. The statistical maps characterizing the hemodynamic reactivity of the vessels are shown for the lateral positions highlighted with yellow dashed lines in the angiograms ((a) & (e)) in tiles (b) to (h). The average of all of the timetraces for both trials are shown in tile (i), whereas a selection of the statistically significant timetraces for each trials are shown in tiles (j) and (k). Interestingly, the higher flow traces are accompanied by a low frequency fluctuation, typically observed in cortical arteries (pointed by the arrows in (j) & (k)). Scalebars: 100 µm.

