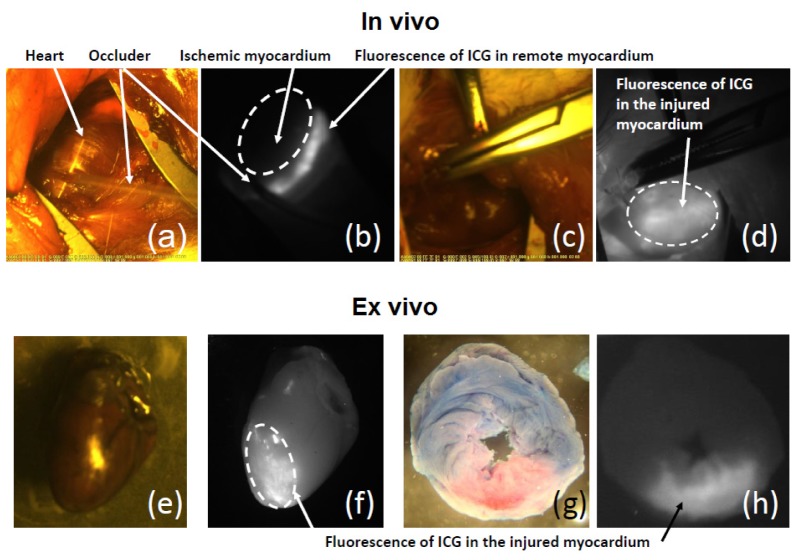
Fig. 3.
– Intravital and post-mortem visualization of the ischemic-reperfused area of the heart with ICG. (a), (b) – Perfusion defect immediately after ICG administration; (c), (d) – Intravital epicardial ICG fluorescence; (e), (f) - Epicardial ICG fluorescence in the excised heart; (g), (h) – Transverse heart slices stained with Evans Blue and ICG obtained after 30 min of reperfusion.

