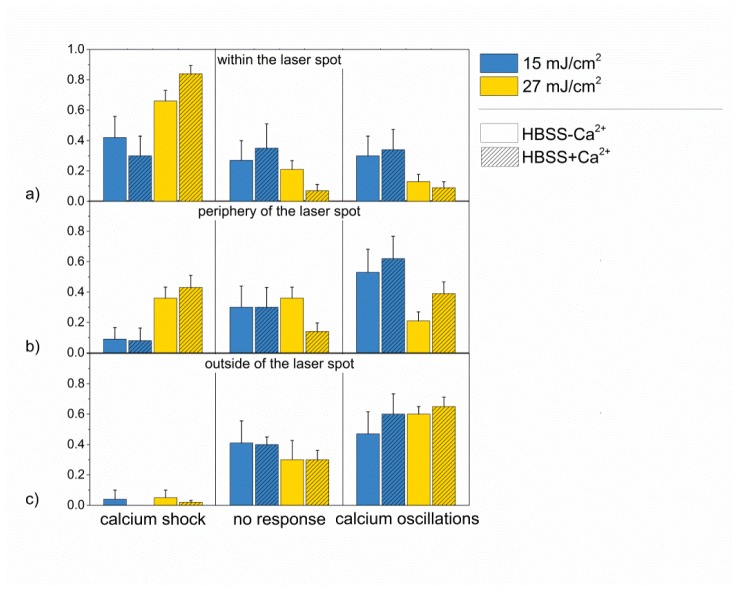
Fig. 3.
Calcium responses of HL-1 cells in Ca2+ containing and Ca2+ free buffer after laser stimulation. Relative frequency of occurrence of the three different calcium responses in HL-1 cells in HBSS + Ca2+ and HBSS-Ca2 after laser stimulation of cells within the laser spot (a), at the periphery of the laser spot (b) and outside of the laser spot (c) for an irradiation time of 20 ms and radiant exposures of 15 mJ/cm2 and 27 mJ/cm2. Data represents the mean + SEM of at least n = 10 irradiated cells.

