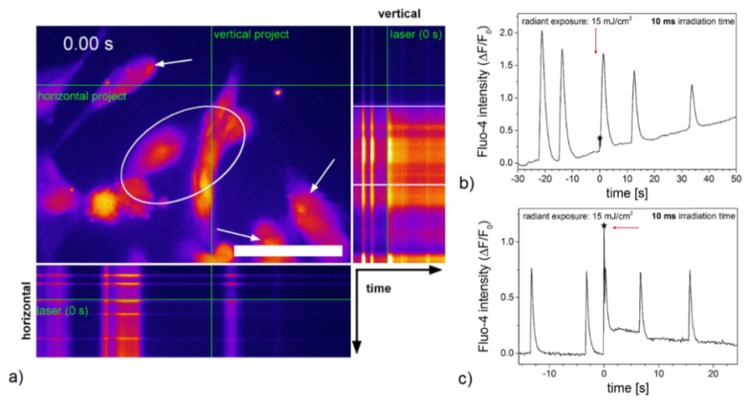
Fig. 6.
Calcium signaling in hESC-derived cardiomyocytes in HBSS + Ca2+ pre and post laser stimulation with a radiant exposure of 15 mJ/cm2 and an irradiation time of 10 ms. An orthogonal projection of Visualization 4 (14.2MB, MP4) indicates the effects of laser stimulation on calcium signaling in hESC-derived cardiomyocytes (a). Scale bar 50 µm. Laser irradiation occurred at 0 s with the laser spot being located within the marked area. The relative fluorescence intensity of cardiomyocytes located outside of the laser spot (marked by arrows) shows the occurrence of a calcium oscillation immediately after laser treatment (arrow and asterisk) (b). Considering a larger field of view using the 10x objective, all hESC-derived cardiomyocytes outside of the laser spot exhibited an additional, simultaneously occurring calcium oscillation immediately after laser treatment (c). Graph (c) refers to Visualization 5 (14.3MB, MP4) . Data shown refers to a single irradiated hESC-derived cardiomyocyte for all graphs out of n = 15 (63x objective) and n = 10 (10x objective) irradiated cells.

