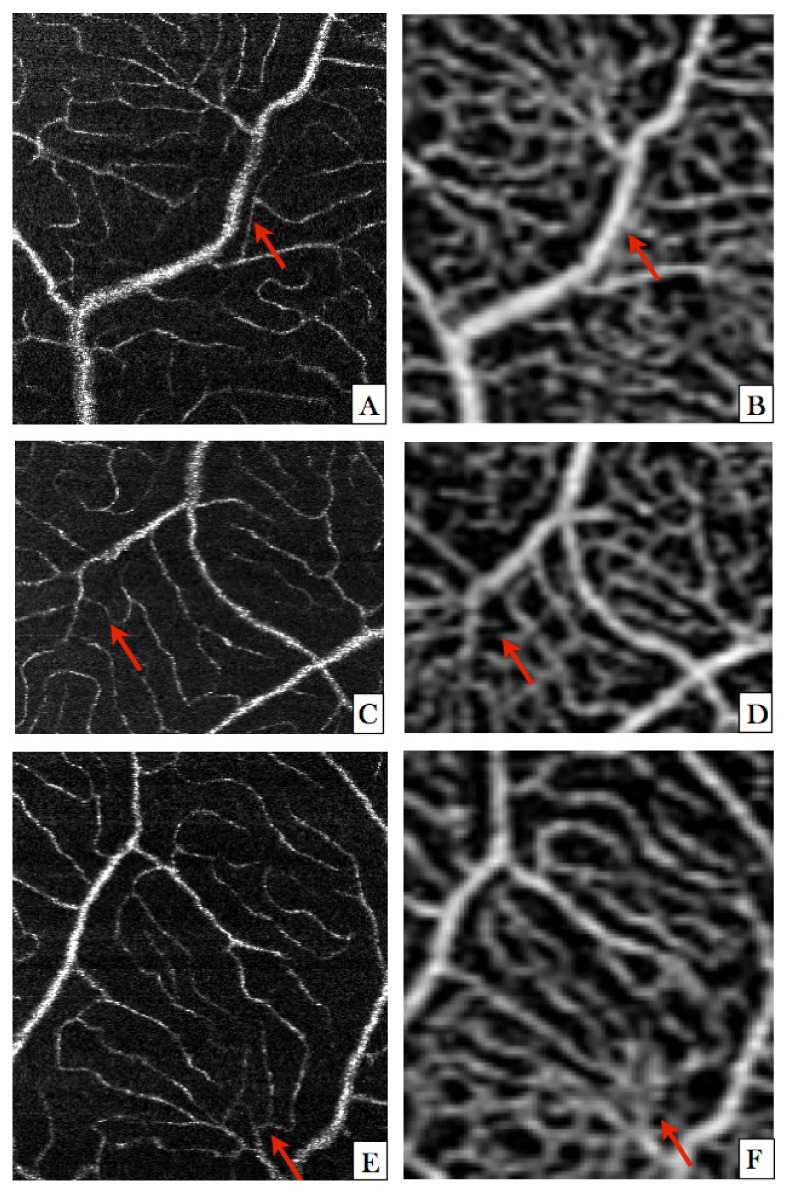
Fig. 10.

AO-OCTA images (left column) and OCTA images (right column) of selected regions of interest compared side by side. The retinal vessels are imaged in the macula region and are depth integrated over region 2 in Fig. 2. The field of view approximately corresponds to the area that can be imaged with the AO-OCTA using a single volume acquisition. (A) AO-OCTA image showing a small vessel (indicated with a red arrow) that proceeds parallel to a larger vessel. (B) The same region as in A) imaged with the commercial instrument. (C) AO-OCTA image showing a continuous vessel loop (indicated with the red arrow). (D) In this image the vessel loop (indicated with the red arrow) seems not to be connected with the main vessel on the left side. (E) AO-OCTA image showing three vessel junctions (indicated with a red arrow). (F) The same region as in E) imaged with the commercial instrument. The vessel junctions cannot be observed. Instead, closed vessel loops can be seen.
