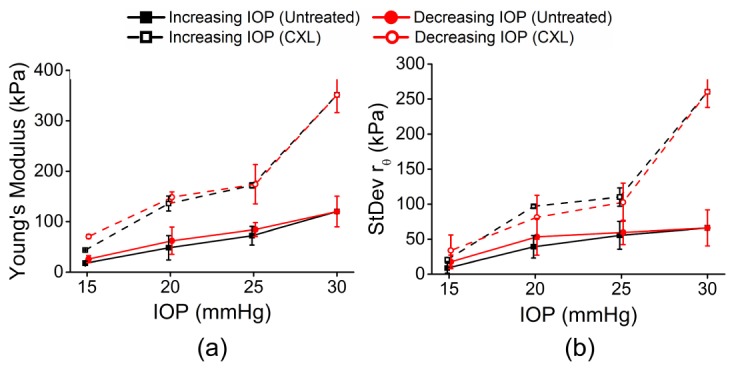
Fig. 6.

Summary of (a) mean Young’s modulus and (b) mean standard deviation of rθ for 4 pairs of corneas (6 untreated samples and 2 CXL-treated samples). In two fellow pairs of samples, both corneas were untreated. In the other two fellow pairs of samples, one cornea was untreated while the fellow cornea was CXL-treated. The error bars are the inter-sample standard deviations of all samples for a given IOP and treatment condition.
