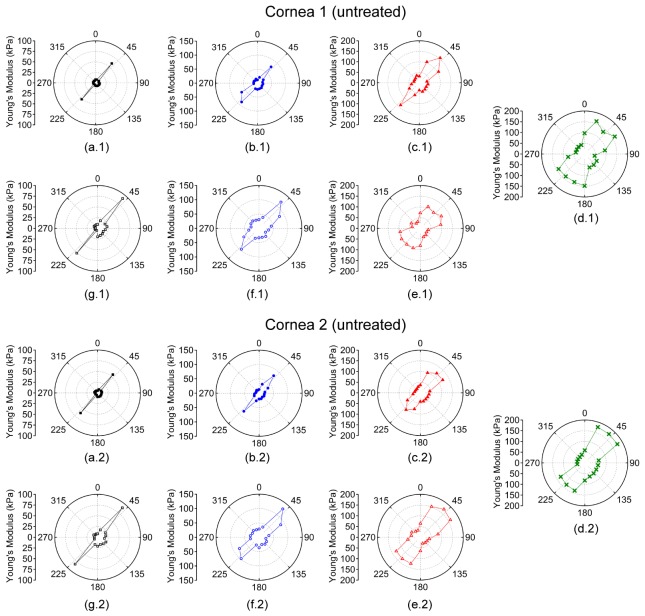
Fig. 8.
Polar plots of the meridional angle-wise average Young’s modulus while increasing IOP at (a) 15, (b) 20, (c) 25, and (d) 30 mmHg and while decreasing IOP at (e) 25, (f) 20, and (g) 15 mmHg. Both corneas were untreated, and the Young modulus scales are the same for a given IOP for both samples.

