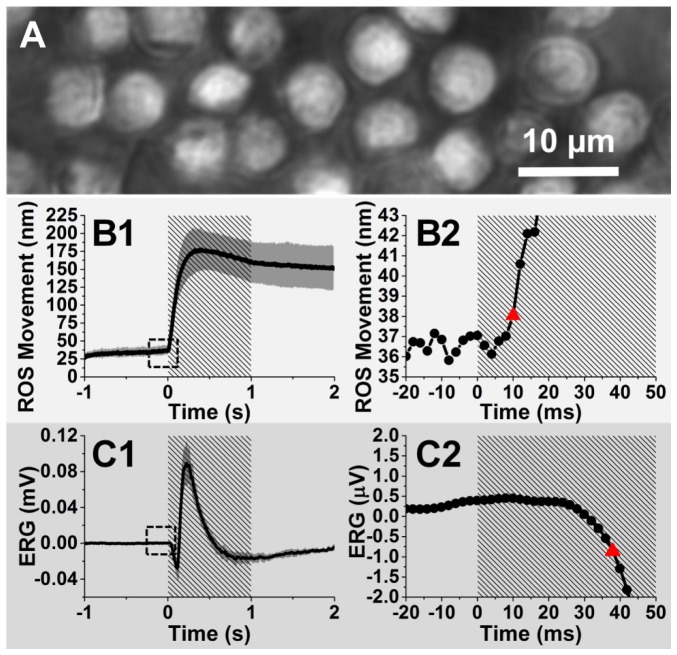
Fig. 3.
(A) Representative ROS image acquired at a frame speed of 500 fps. Time course of the averaged mean movement magnitudes of ROSs (B1), and averaged ERGs (C1) acquired from ten different retinal locations. (B2) Enlarged picture of the dashed square in B1. (C2) Enlarged picture of the dashed square in C1. The red triangles in B2 and C2 indicate the onset times determined by the 3-δ threshold of ROS movement and ERG a-wave, respectively. Each data point shown in C2 (sampling rate of the original data: 10 kHz) represents the value exhibited at the end of a given 2-ms interval. Gray areas in B1 and C1 show standard deviations. Shaded areas in B1, B2, C1, and C2 represent stimulation periods.

