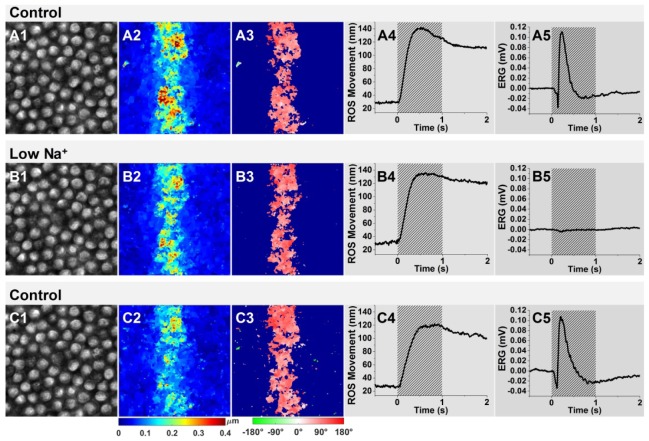
Fig. 4.
Comparison of ROS movements and ERGs between control groups (superfusion with Ringer’s medium) and the low-sodium group (superfusion with low-sodium medium). The retina superfusion followed a sequence of Ringer’s medium superfusion (control group), low-sodium medium superfusion (low Na+ group), and Ringer’s medium superfusion (control group). Representative ROS images acquired from the same area of the retina before (A1), during (B1) and after (C1) superfusion with the low-sodium medium. Representative movement magnitude maps and movement direction maps, before (A2, A3, respectively), during (B2, B3, respectively) and after (C2, C3, respectively) superfusion with the low-sodium medium. Time course of the mean movement magnitude of ROSs and ERGs acquired before (A4, A5, respectively), during (B4, B5, respectively) and after (C4, C5, respectively) the low-sodium superfusion. The magnitude maps (A2, B2 and C2) and direction maps (A3, B3 and C3) were calculated from the retinal images acquired at 0.4 s after the onset of the stimulus in the different groups.

