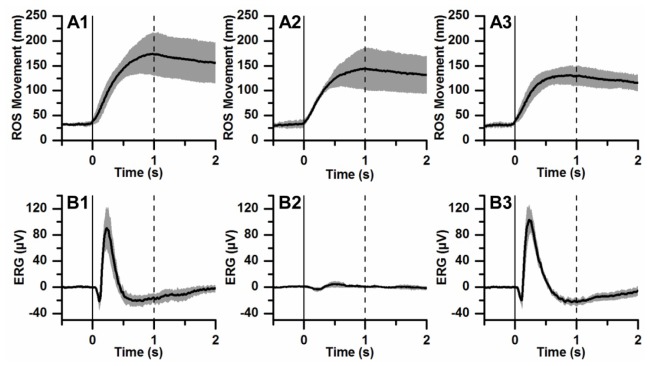
Fig. 5.
Averaged ROS movements (A) and ERGs (B) of control (A1, B1), low-sodium (A2, B2), and recovery (A3, B3) groups. Each trace is the average of data obtained from 6 frog retinas. The gray area that accompanies each trace illustrates standard deviation. Vertical solid and dashed lines show stimulus onset and offset, respectively.

