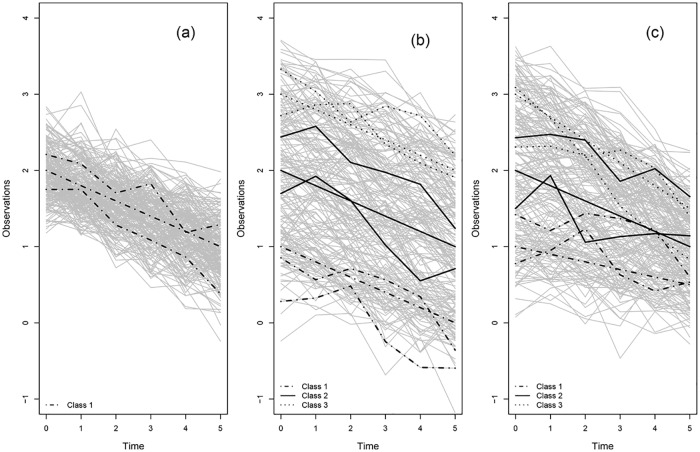
Fig 2. Longitudinal simulated data study.
The left profile belongs to a homogeneous population with one class. The middle one belongs to a population with three classes where classes differ only in intercept, and the right profile belongs to a heterogeneous population with three classes where classes differ both in intercept and slope.

