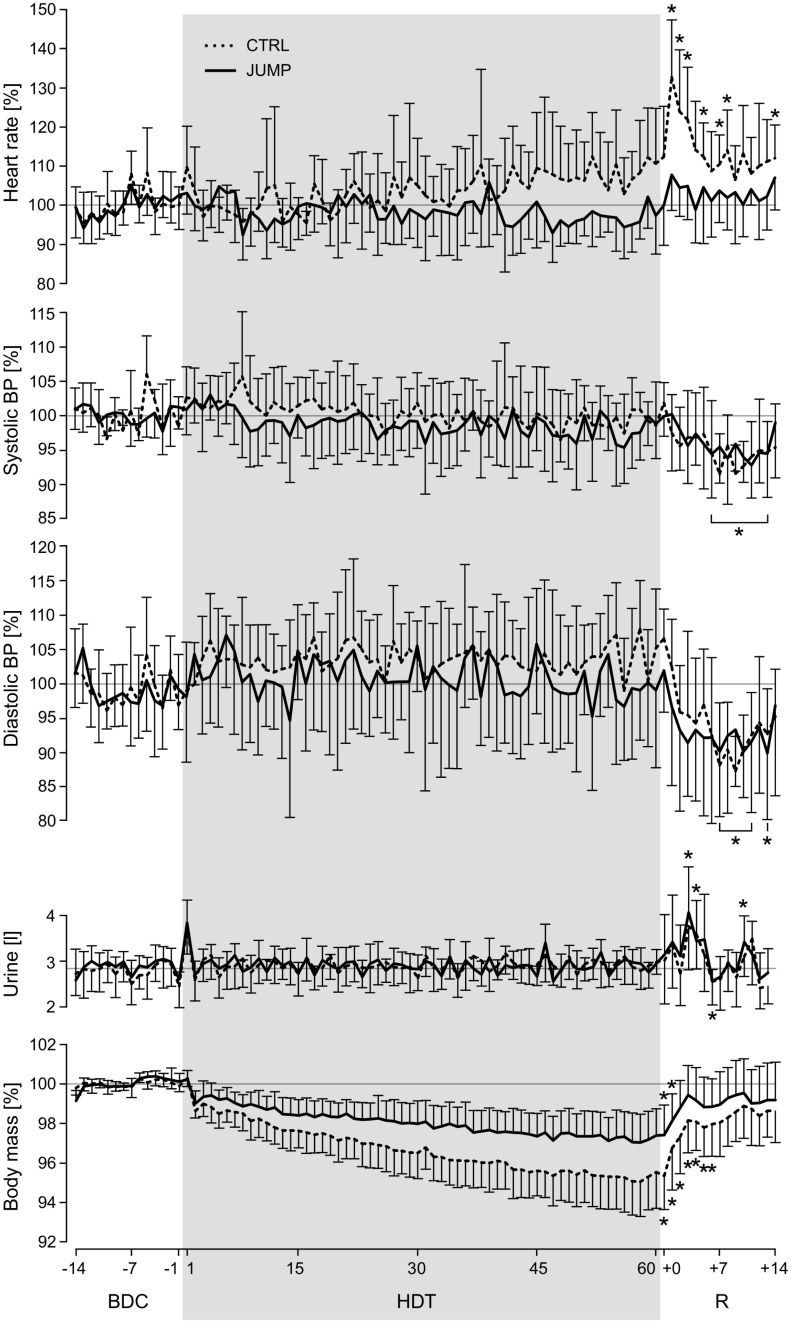
Fig 6. Daily measurements.
Vitals, urine volume and body mass measured daily in the morning, normalized to baseline values (mean of BDC-14 through BDC-1). Broken lines represent the mean and standard deviation of the control group, solid lines represent mean and standard deviation of the training group. Values during the recovery phase (R+x) that differ significantly from baseline values are marked with an asterisk symbol (for heart rate and body mass separately for CTRL and JUMP, for blood pressure and urine for all subjects together, as these parameters showed no significant differences between groups). Note that from R+0 until R+5, subjects’ fluid intake had no upper limit.

