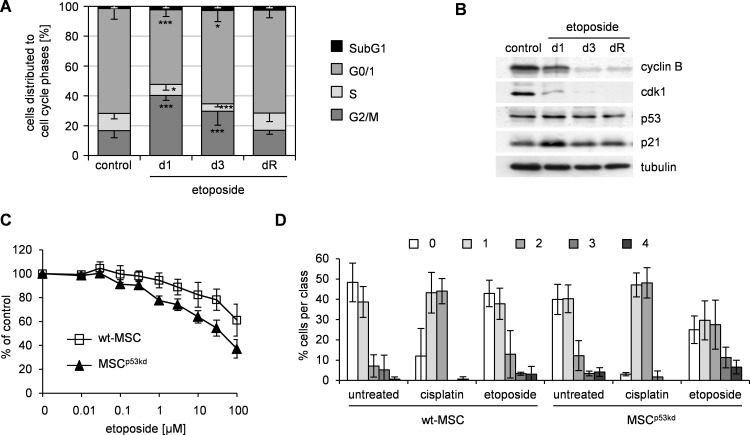
Fig 4. Knock down of p53 increases resistance of MSC to etoposide.
(A) MSC were treated on day 0 for 24 h with 0.75 μM etoposide. On day 1, 3 and upon reconstitution of proliferation (dR) cells were harvested, respectively. Untreated cells served as control. Cell cycle analyses were performed upon propidium iodide staining. Data are presented as% of cells distributed to cell cycle phases as mean—standard deviation; n ≥ 6; * p < 0.05, *** p < 0.001 vs. control. (B) Whole protein lysates from the experiment shown in (A) were analyzed by western blot. Tubulin served as loading control. Data are representative of 3 independent experiments. (C) MSC with p53 knock down (MSCp53kd) and wildtype MSC (wt-MSC) were treated with etoposide for 96 h. Subsequently cell survival was analyzed by SRB assay and represented as% of untreated control as mean ± standard deviation in semilogarithmic dose-response plots; n = 3. (D) MSCp53kd and wt-MSC were treated with 20 μM cisplatin or etoposide for 24 h. DNA damage was analyzed by visual scoring of comet assay (class 0 –no DNA damage, class 4 –fully damaged DNA). Respective untreated cells served as control. The diagram summarizes 3 independent experiments with a minimum of 36 analyzed comets per condition and experiment.

