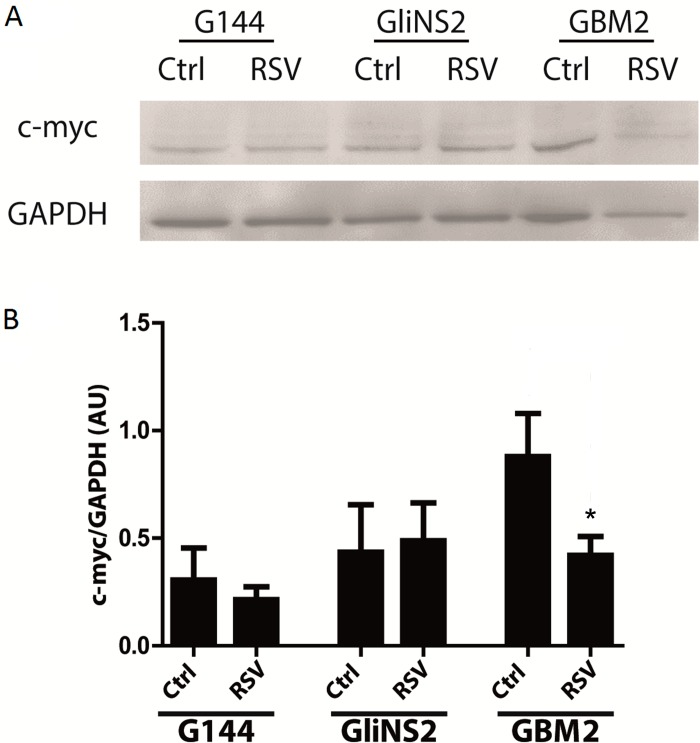
Fig 8. c-Myc protein levels were downregulated by RSV administration in GBM2 cells.
(A) Representative images of Western blot analysis of c-Myc on G144, GliNS2 and GBM2 cells total protein extracts. GAPDH was used as loading control. (B) Quantitative densitometry analysis of 4 independent experiments. c-Myc protein levels were normalized on GAPDH and expressed in Arbitrary Units (AU). Bars represent SEM. Indicated p-values were obtained after two-tailed paired t-test. * p<0,05.

