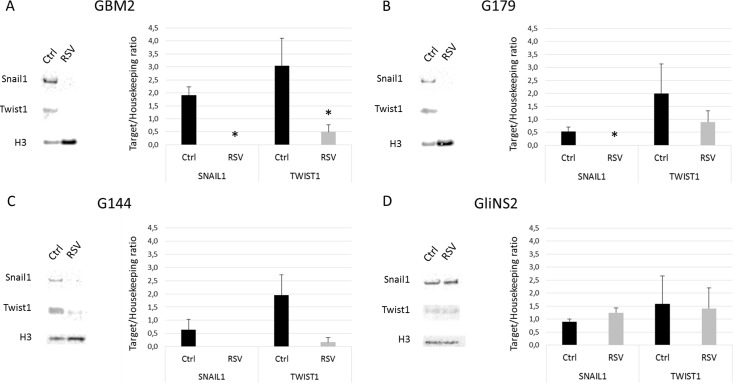
Fig 9. Twist1 and Snail1 protein levels after 100 μM RSV administration for 96 hs.
Representative images of Western blot analysis of nuclear Twist1 and nuclear Snail1 in GBM2 (A), G179 (B), G144 (C) and GliNS2 (D) cells and quantitative densitometry analysis of at least three independent experiments. H3 Histone was used as loading controls. Nuclear Twist1 and nuclear Snail1 protein levels were normalized on H3 Histone and then expressed in Arbitrary Units (AU). Bars represent SEM. * p<0,05.

