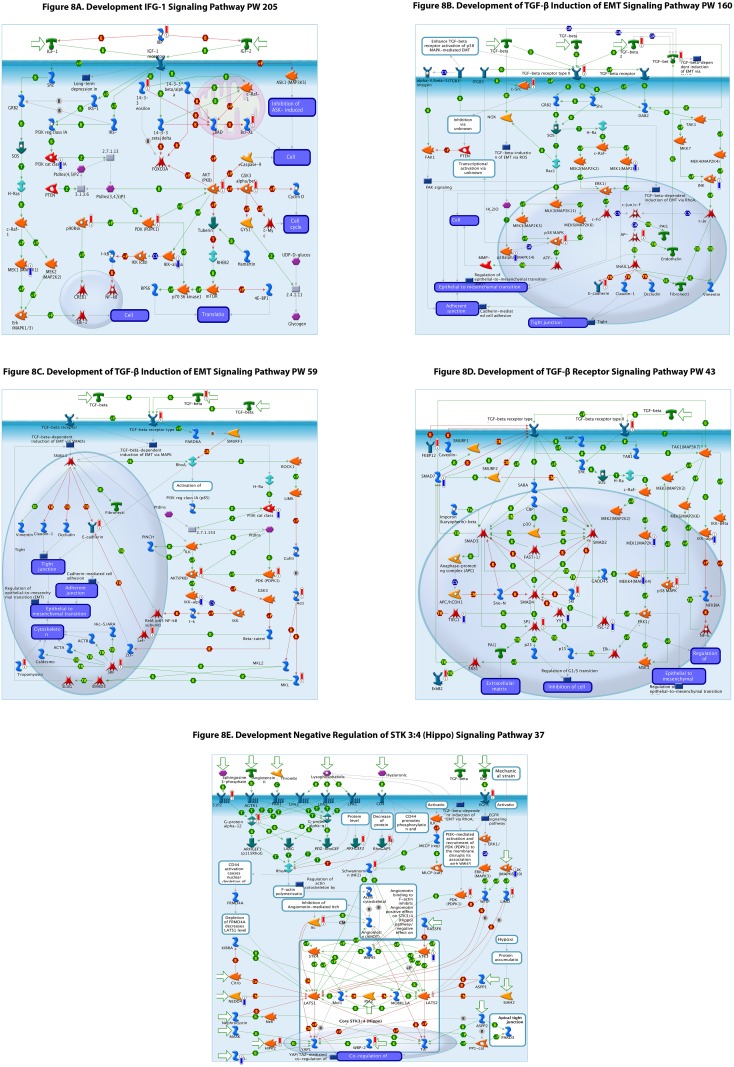
Fig 8. (A-E) Selected signaling pathway schematics demonstrating increase (red bar) or decrease (blue) bar and relative amplitude (height of bar) of differentially expression in each gene and their roles in the signaling pathway depicted.
Green arrows indicate positive interactions or activation, red arrows indicate negative interactions or inhibition, while grey arrows indicate an unknown interaction. More details of symbol meanings can be found in the supplemental tables in the Metacore ® quick reference guide.

