. 2016 Dec 12;5:e21422. doi: 10.7554/eLife.21422

Figure 2. The HK:RR interface and structural variability.

(A) Structural superposition of the DesK:DesR phosphatase complex (this study, PDB 5IUN) with HK853:RR468 from Thermotoga maritima (PDB 3DGE). Only selected structural elements from both partners are shown as cartoons for clarity. The DesK:DesR phosphotransferase complex is overall similar (not shown here). DesK and DesR are illustrated with the same color code as in Figure 1. Superposed T. maritima RR468 helix α1 is shown in gray, and HK853 protomers in cyan and blue. Primed labels distinguish DHp helices from each HK protomer. (B) Close-up of the phosphatase complex DesK:DesR interface showing only a few selected interactions for clarity (see text for detailed description). Coloring scheme as in (A). Note Leu200(HK) inserted into a hydrophobic pocket of DesR, and several other hydrophobic residues completing the interface (not labeled, shown as sticks). Among the polar contacts surrounding the hydrophobic core, Arg235(HK):Asp103(RR) and Gln193(HK):BeF3--modified Asp54(RR), are highlighted. (C) Solvent accessible surface of DesKCSTAB indicating the interaction footprint (in magenta) with DesR in the phosphatase complex. DesK domains are highlighted in green (DHp) and blue (CAs); these domains participate differently in DesR interaction, depicted in light magenta (DHp) and dark magenta (CA). Note the ATP analogue (AMP-PCP, in sticks colored by atom) bound to the CA domains, visible in this view on the rightmost one. (D) Same as (C), but for the phosphotransferase complex, illustrating the DesR-binding surface of DesKCH188E. (E) The variable position of the REC(RR) domain with respect to the DHp(HK) is illustrated, superimposing the structurally invariant region of the DHp (including the nine independently refined DesK:DesR complexes). The coloring scheme is the same as in (A), with light and dark colors distinguishing phosphotransferase and phosphatase complexes, respectively. (F) The solid volume corresponds to DesR-REC, which is shown sliced to highlight its outline, revealing unfilled cavities at the protein:protein interface. The relative position of interfacing amino acids is roughly indicated with residue labels. DesK DHp helices are shown in cartoon representation, with its superposed molecular surface on top. Two key residues on the HK partner are shown as sticks.

DOI: http://dx.doi.org/10.7554/eLife.21422.008

Figure 2.

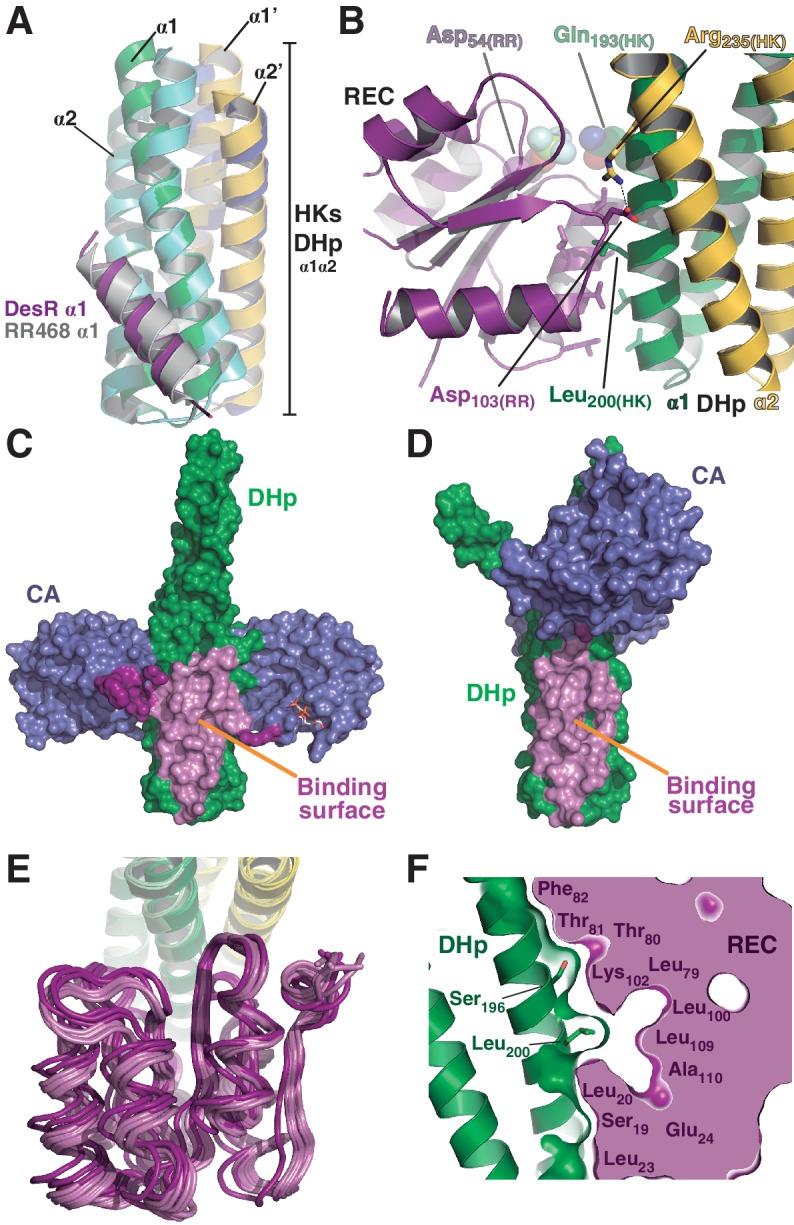
Figure 2—figure supplement 1. Structural details of the DesK:DesR interface.

Figure 2—figure supplement 1.

(A) Sequence covariance among HK:RR pairs measured by direct coupling analysis. Included HK sequences belong to family HisKA_3, and RRs to family NarL/LuxR (see Materials and methods section for full details). The Table on the right, shows the actual Mutual Information (MI) and Direct Information (DI) figures ranking the highest 15 inter-protein pairs of residues (intra-protein pairs are not shown). The cartoon representation on the left, highlights those 15 pairs as spheres (colored red for DesR and orange for DesK) within the 3D structure of the DesK:DesR phosphotransferase complex shown in cartoon representation (same color scheme as Figure 2B). (B) DesK:DesR interface observed from a different perspective compared to Figure 2B, following the same color scheme. The phosphotransferase complex is shown, with the solvent-exposed surface of DesR shown in semi-transparent gray. The surface highlights the RR pocket that lodges Leu200(HK), further extended into a groove to the right of the figure. This groove ends in the reaction center, referenced by Asp54(RR) and P~His188(HK) (modeled in place after in silico substitution of Glu188(HK)). (C) Complementing Figure 2 (panels C and D), solvent-exposed surface representations of the phosphatase and phosphotransferase complexes, are shown in two orientations (top and bottom panels). The distinct interaction of DesR with the CA domains is evident.
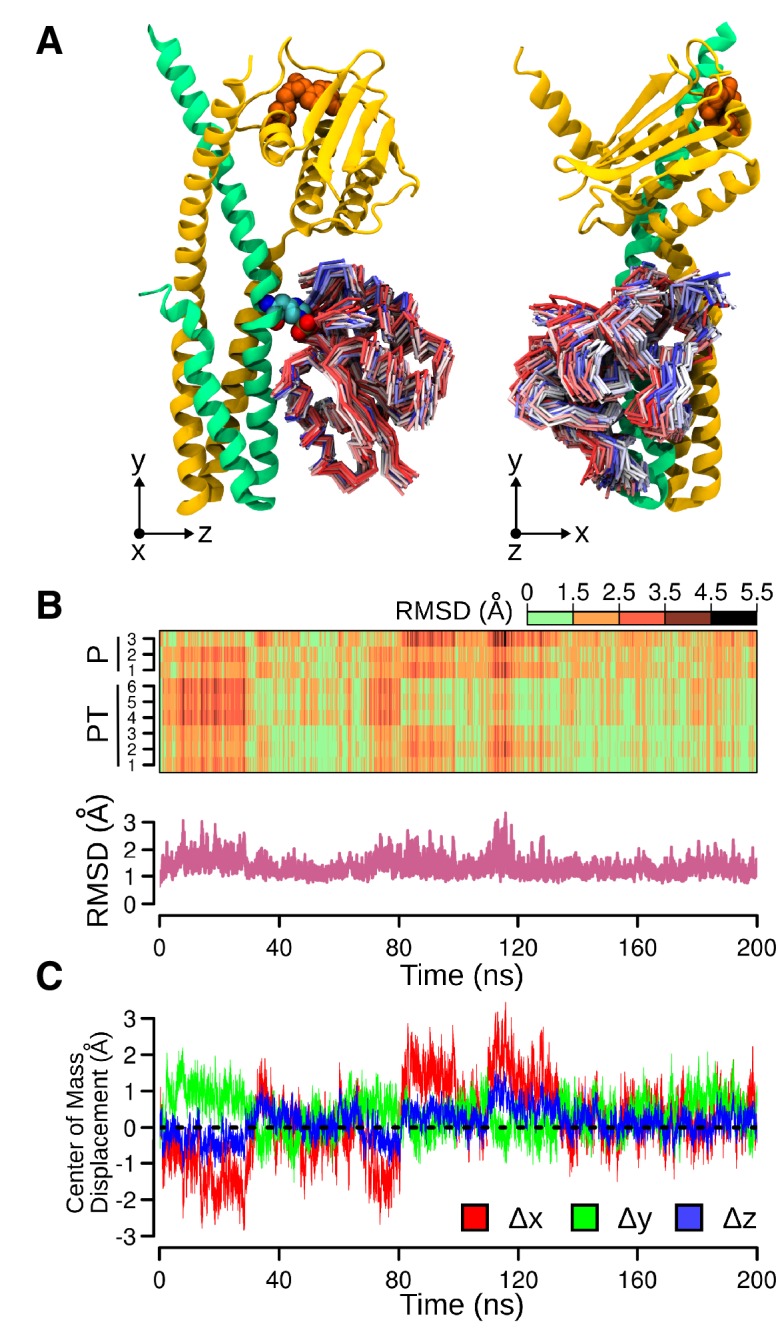
Figure 2—figure supplement 2. Molecular dynamics (MD) simulation of the phosphotransferase complex.

Figure 2—figure supplement 2.

(A) Molecular representations of the movements of DesR-REC on the DesK:DesR interface. Two orthogonal views are displayed (left and right). The initial conformation of DesK's chains is represented as cartoons in green and yellow, with ATP moieties (orange) and P~His188(HK) residues (colored by atom) shown as spheres. To represent the different structures adopted by DesR-REC during the simulation, a conformation was selected every 5 ns of trajectory, and depicted as tubes. The DesR-REC coloring scheme follows a red-to-blue gradient according to the accumulated simulation time of each model. The system was previously fitted to the invariant region of DesK DHp domain (residues 190–234) and oriented according to the inertial tensor matrix of this domain (XYZ axes are shown at the bottom of each representation). (B) On top, a time-dependent (x-axis) heat-map illustrating the variation of RMSDs of DesR-REC domains of the nine independently refined DesK:DesR complexes (y-axis; P = phosphatase complex, PT = phosphotransferase complex) with respect to the crystallographic starting structure, along the MD trajectories illustrated in panel (A). The RMSDs were always calculated after fitting the MD frames to the invariant region of DesK DHp domain (residues 190–234). Bottom part, minimum RMSD values taken from the heat-map matrix on top. (C) Further quantitative analysis of panel (A), here the relative movement of the DesR-REC domain is revealed plotting its center of mass as displaced from the initial structure (after fitting to the invariant region of DesK DHp domain). The reference XYZ system of coordinates is shown in panel (A).