. 2016 Dec 12;5:e21422. doi: 10.7554/eLife.21422

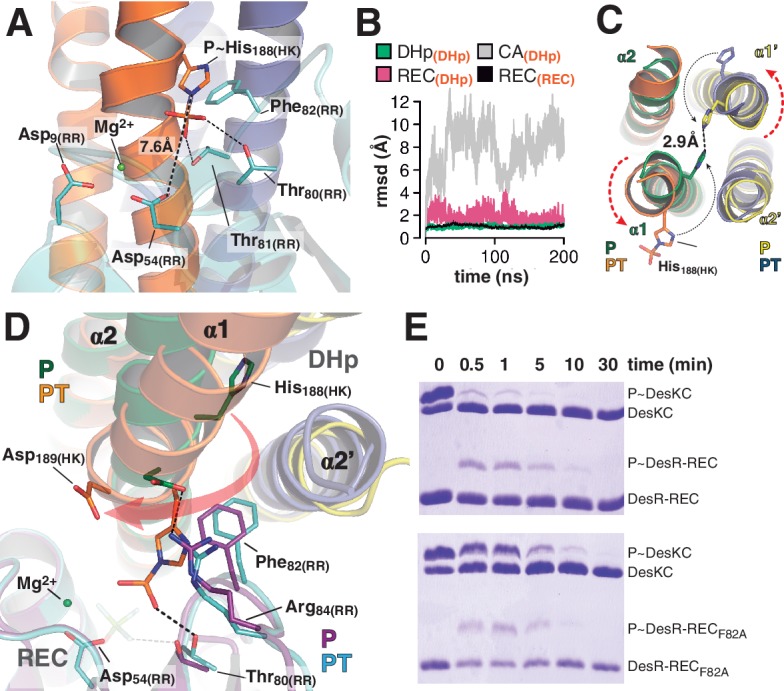
Figure 4. At the reaction center: the phosphatase to phosphotransferase transition.

(A) Cartoon model of the phosphotransferase reaction center prior to DesR phosphorylation (see model construction details the Materials and methods section). DesK protomers (orange and blue) and DesR (cyan, transparent for clarity) are displayed with selected key residues in sticks colored by atom. Mg2+ (green sphere) is already in place, coordinated by the two shown Asp residues and water molecules (not included). Phosphoryl moiety interactions with DesR, and the reactive Asp-His distance are indicated. (B) Evolution of the atomic coordinates of the phosphotransferase complex along molecular dynamics (MD) calculations. Selected HK or RR domains were structurally aligned (marked with orange subscripts on each curve’s label on top), to thereafter compare the evolving MD model with the initial experimental structure (calculating rmsds of chosen domains as marked in black fonts on each curve’s label on top). Resulting rmsds for all Cα atoms of chosen domains are plotted (colored curves) as a function of time. Note that the time lapse is enough to detect large CA mobility (gray curve) whereas the DHp:REC complex remains attached and stable (pink curve). (C) Cartoon illustration of the HK DHp domains of the phosphatase complex (P), with its two HK protomers in green and yellow, superposed onto the phosphotransferase (PT) in orange and blue. Residue His188(HK) (in sticks) reveals the rotational rearrangement between both states. (D) Similar phosphatase vs phosphotransferase illustration as in (C), along a different view. The RR partner is now shown (magenta for the phosphatase complex [P], cyan for the phosphotransferase [PT]). The Arg84(RR):Asp189(HK) salt bridge is disrupted in the PT complex due to the DHp rotational shift (red arrow). Note the shift of the RR β4α4 loop, including Phe82(RR), propagating toward Thr80(RR). The latter is positioned at H-bonding distance to the phosphoryl group either on the P~His or on the P~Asp residue (the BeF3- moiety in the P complex is transparent), with a shift of 1.5 Å of its side chain O atom. (E) Phosphotransfer kinetics comparing wt DesR-REC (top panel) with phosphate lid mutant DesRF82A-REC (bottom panel), revealed by Phos-tag SDS-PAGE.
DOI: http://dx.doi.org/10.7554/eLife.21422.014

Figure 4.

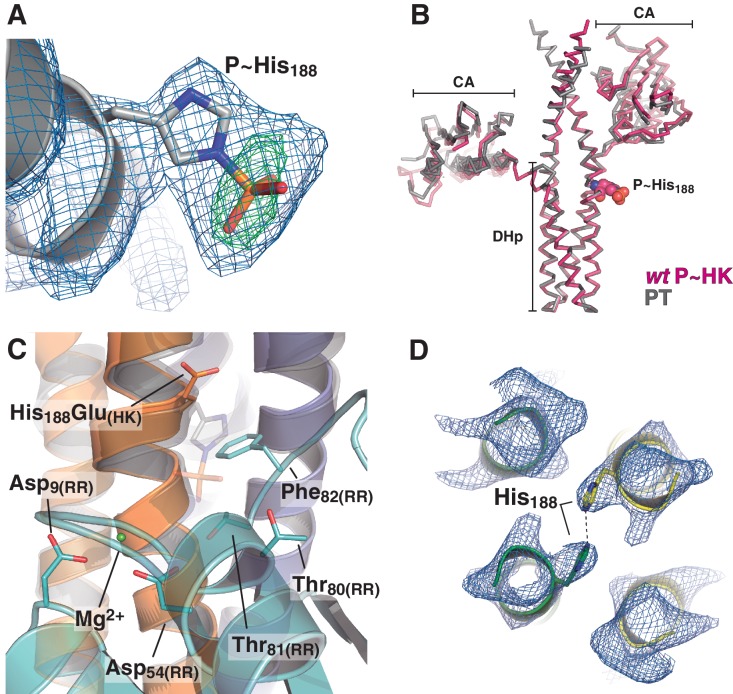
Figure 4—figure supplement 1. Electron density maps and structural similarity of wt P~DesKC compared to DesKCH188E in the phosphotransferase complex.

Figure 4—figure supplement 1.

(A) Fourier maps are shown with the final wt P~DesKC refined model (cartoon representation only showing DHp helix α1, and the P~His188(HK) in sticks). Maps were calculated with sigmaA-weighted coefficients 2mFobs-DFcalc (blue mesh) and mFobs-DFcalc (green mesh), generated after convergent refinement excluding the phosphoryl moiety. The Fourier difference peak has an rmsd of 5. (B) The DesKCH188E partner (in gray) was extracted from the phosphotransferase complex (labeled PT, chains A and B from PDB 5IUK, this report), and superimposed onto wt P~DesKC (in pink, PDB 5IUM, this report) revealing high global structural similarity (see main text). The P~His188(HK) residue is highlighted in spheres as a spatial reference. (C) Same view and coloring scheme as Figure 4A, highlighting the crystal structure of the phosphotransferase complex (PDB 5IUK, this report). The RR is rendered semi-transparent to allow for better visualization of selected residues (in solid sticks). The model whereby the DesKCH188E partner (from PDB 5IUK) has been substituted by the superposed wt P~DesKC (from PDB 5IUM), is shown as a transparent cartoon. The P~His188(HK) residue is shown in transparent sticks representation. This model was minimized to adjust minor clashes (full details in Materials and methods) and thereafter used for structural analyses of the phosphotransferase reaction center (see Figure 4A). (D) Representative sigmaA-weighted 2mFobs-DFcalc Fourier map (contoured at 1σ) of the refined phosphatase complex model, centered on the DHp domain at the level of the reactive His188(HK) (shown as sticks), other residues have been excluded from the illustration for greater clarity. The DHp helices are shown as cartoons (the two HK protomers depicted in green and yellow). The HK CA domains and the associated DesR-REC domains in the complex are not shown for clarity.
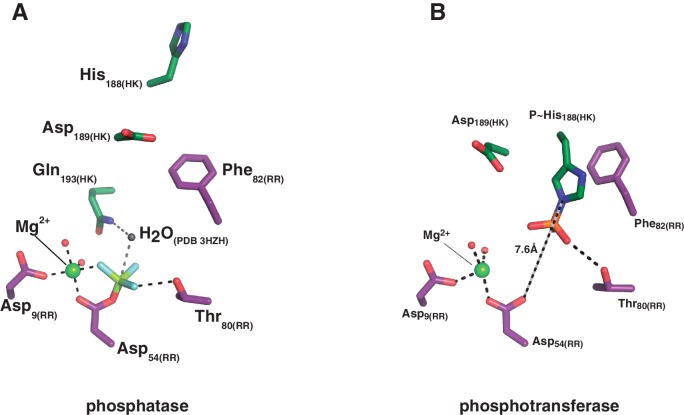
Figure 4—figure supplement 2. Structural details of the reaction centers.

Figure 4—figure supplement 2.

(A) Active site for the dephosphorylation reaction, according to the phosphatase complex structure (this study, PDB 5IUN). For clarity only the relevant residues’ side chains are shown (in stick representation, with carbon atoms in green for the kinase, and purple for the regulator). The magnesium atom is shown as a green sphere within its coordination site in the regulator, with five of the six coordination bonds depicted as dashed lines: two water molecules (small red spheres), the side chain oxygens of aspartates 9 and 54, and an oxygen of the phosphoryl group bonded to the reactive Asp54(RR) (the phosphoryl group in the structure is actually a BeF3- mimicking the ortho-phosphoryl moiety, so that the Mg2+-chelating atom is fluorine, in light blue). The sixth Mg2+-coordinating atom is the main chain oxygen of Glu56(RR), not shown here for clarity. The water molecule (gray sphere) was not observed in the structure, it is here modeled after superposition of the CheX:CheY3 complex (PDB 3HZH). The figure shows the side chain nitrogen from Gln193(HK) positioning the catalytic water (this Gln rotamer was chosen according to H-bonds with Lys102(RR) and one of the Mg2+-coordinating water molecules, as observed in the structure, but the Gln193(HK) side chain could easily flip so that the amide oxygen eventually assists the catalytic water as a nucleophile to attack the phosphorus atom). The H-bond between the side chain oxygen of Thr80(RR) and the phosphoryl group is also highlighted with a dashed line, to be compared with panel (B). (B) Active site for the phosphoryl-transfer reaction, according to the phosphotransferase complex structure (this study, PDB 5IUK). Similar orientation view and coloring scheme as in panel (A). Glu188(HK) is shown here as a P~His after superposition of the wt P~DesKC structure (this study, PDB 5IUM) and substitution of the Glu188(HK) residue by the P~His188(HK) (full details in Materials and methods). Predicted distance separating the Nε2 atom on His188(HK) and the receiver oxygen on Asp54(RR) is labeled. Also highlighted with a dashed line is the expected H-bond between the phosphoryl-group on the reactive His and the side chain of the ultraconserved residue Thr80(RR). The magnesium atom (green sphere) displays a full octahedral coordination sphere, for clarity one equatorial and one axial coordination bonds are not shown here: respectively with the main chain oxygen of Glu56(RR), and with a water molecule that replaces the phosphoryl group coordination observed in panel (A).
Figure 4—figure supplement 3. Phosphate lid opening for RR dephosphorylation.
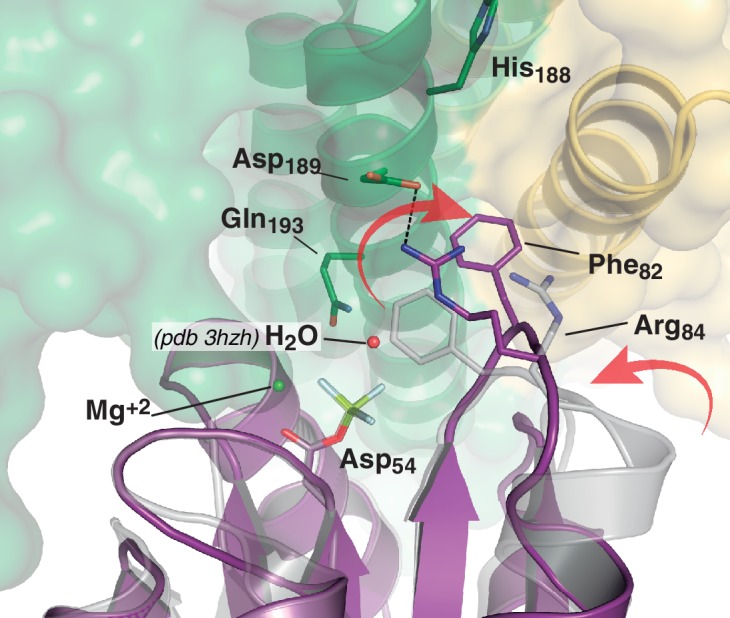
Figure 4—figure supplement 3.

Superposition of DesR-REC in its free active form with BeF3- (PDB 4LE0, in gray), onto the DesR-REC domain of the phosphatase complex (with DesK in green and yellow, and DesR in magenta). The solvent-exposed surface of DesK is shown in transparent representation. Red arrows indicate major conformational shifts associated with the interaction between both proteins. Such shifts result in the opening of the phosphate lid, making enough space for a water molecule to enter into the reaction center and perform the nucleophilic attack onto the P atom. The water molecule was not observed in our phosphatase complex, likely due to limited resolution; here a water molecule was modeled (red sphere) using as a template the structure of the CheX:CheY3 complex (PDB 3HZH) superimposable onto ours.