. 2016 Dec 24;5:e20362. doi: 10.7554/eLife.20362

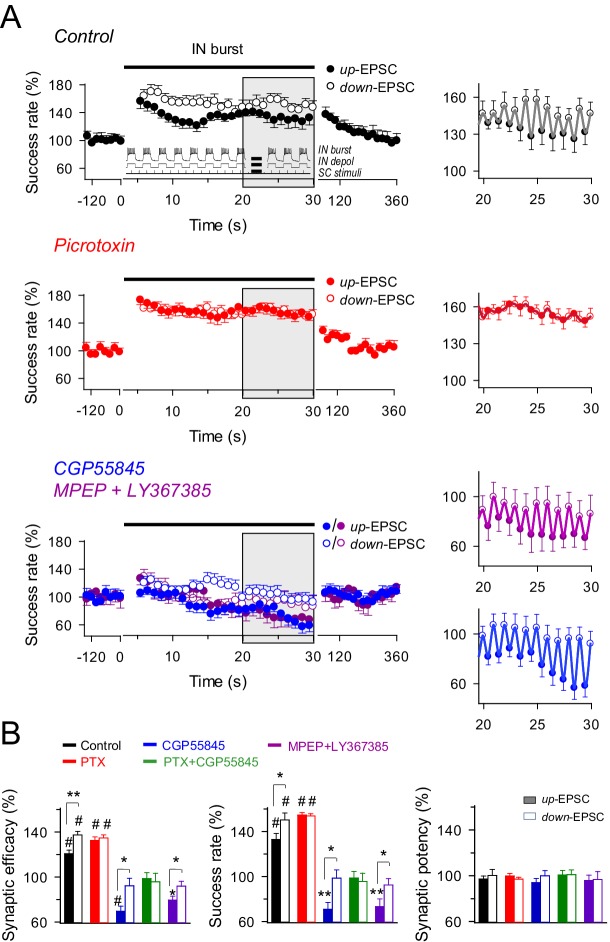
Figure 5. Effects of dynamic interplay between interneuron and astrocyte activity on excitatory synaptic transmission.

(A) Left, averaged relative success rate of up-EPSCs and down-EPSCs over time evoked by a stimulation paradigm (inset) consisting of SC stimuli at 6 Hz and bursts of interneuron APs elicited by 90 depolarizing pulses (166 ms delivered at 3 Hz for 30 s), in control (black; n = 13), picrotoxin (PTX, red; n = 11), CGP55845 (blue; n = 11), and MPEP+LY (magenta; n = 8). Note that SC stimuli were phase-locked at the interneuron depolarization (up-EPSC) or resting level (down-EPSC). Each point represents the simple moving average of 15 consecutive EPSCs (note the corresponding initial gap at interneuron stimulation). Horizontal bars indicate the time of pairing. Right, expanded view of gray-shaded areas. (B) Relative changes of synaptic parameters relative to basal of up-EPSCs (closed bars) and down-EPSCs (open bars) in control and after receptor antagonist application (PTX + CGP55845; n = 9). See also Figure 5—figure supplements 1 and 2. *p<0.05, **P<0.01, #p<0.001; paired t test.

DOI: http://dx.doi.org/10.7554/eLife.20362.009

Figure 5.

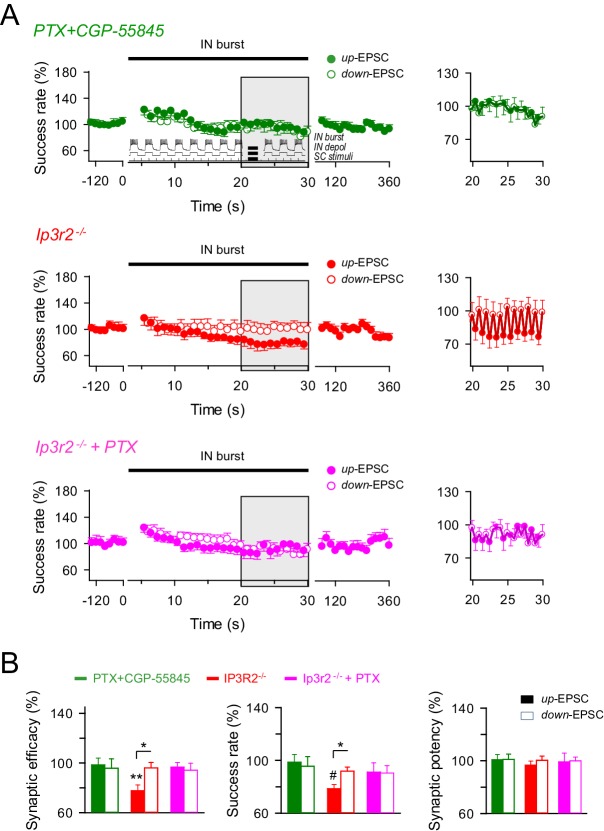
Figure 5—figure supplement 1. GABAA and GABAB interplay in the astrocyte-interneuron modulation of the excitatory synaptic transmission.

Figure 5—figure supplement 1.

(A) Left, averaged relative success rate of up-EPSCs (closed circles) and down-EPCSs (open circles) evoked by the stimulation protocol described in Figure 5 (inset) over time in wild-type mice in the presence of picrotoxin plus CGP55845 (PTX+CGP; green), and in Ip3r2-/- mice in control (red) and in the presence of picrotoxin (PTX; pink). Each point represents the simple moving average of 15 consecutive EPSCs. Horizontal bars indicate the time of pairing. Right, expanded view of gray-shaded areas. (B) Relative changes of synaptic parameters for up-EPSCs (filled bars) and down-EPSCs (open bars) in wild-type mice in the presence of picrotoxin plus CGP55845 (PTX+CGP; green; n = 9; p=0.81 (synaptic efficacy up); p=0.61 (synaptic efficacy down); paired t test), and in Ip3r2-/- mice in control (red; n = 7; p=0.004 (synaptic efficacy up); p=0.37 (synaptic efficacy down); paired t test) and in the presence of picrotoxin (pink; n = 10; p=0.46 (synaptic efficacy up); p=0.35 (synaptic efficacy down); paired t test). *p<0.05, **p<0.01, #p<0.001. Error bars indicate SEM.
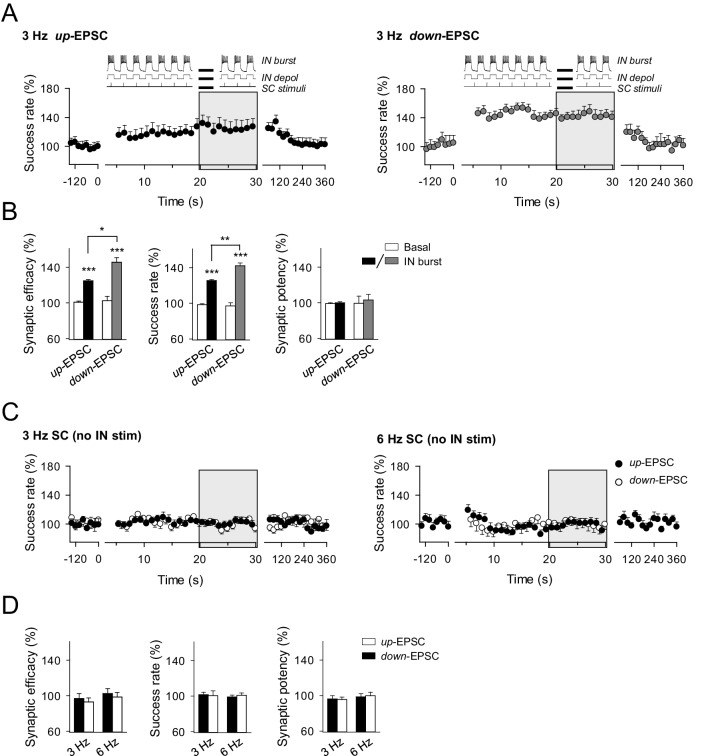
Figure 5—figure supplement 2. Effects of phase-locked activity between interneuron and excitatory synaptic activity.

Figure 5—figure supplement 2.

(A) Averaged relative changes of success rate over time during a stimulation paradigm consisting of SC stimuli at 3 Hz and bursts of interneuron APs (top panel schemes, and described in Figure 5), when SC stimuli coincided with the interneuron up-state, i.e., during the interneuron bursts of APs (n = 6, left), or down-state, i.e., during the resting state between two consecutive interneuron bursts of APs (n = 5; right). (B) Relative changes of synaptic parameters for conditions shown in A. Synaptic efficacy up: p<0.001; paired t test. Synaptic efficacy down: p<0.001; paired t test. Synaptic efficacy up vs down: p=0.016; unpaired t test. (C) Relative changes of success rate over time for up-EPSCs and down-EPSCs, without interneuron stimulation, evoked by SC stimulation at 3 Hz (n = 8) and 6 Hz (n = 11). (D) Relative values of synaptic parameters in the absence of interneuron stimulation. SC stimulation 3 Hz (n = 8; p>0.05; paired t test) and 6 Hz (n = 11; p>0.05; paired t test). *p<0.05, **p<0.01, ***p<0.001. Error bars indicate SEM.