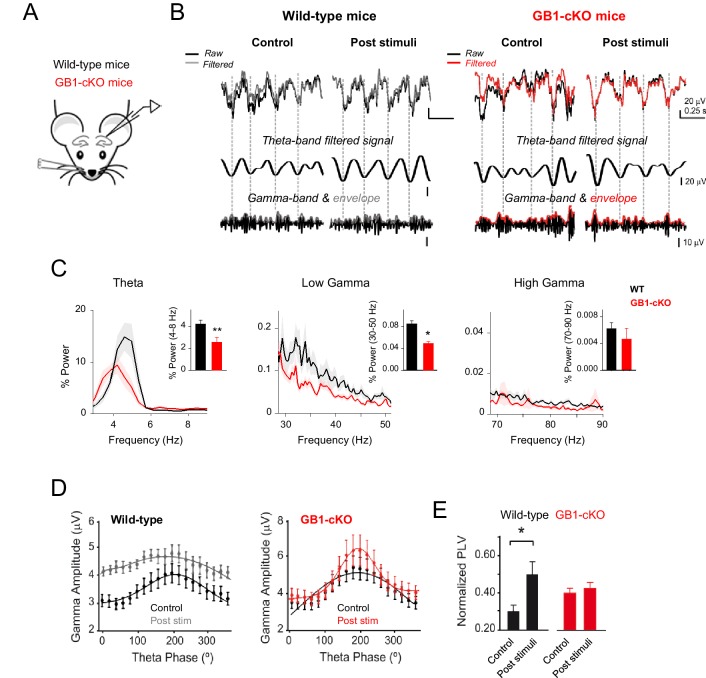
Figure 7. Astrocyte GABAB receptors participate in hippocampal theta and gamma oscillations in vivo.
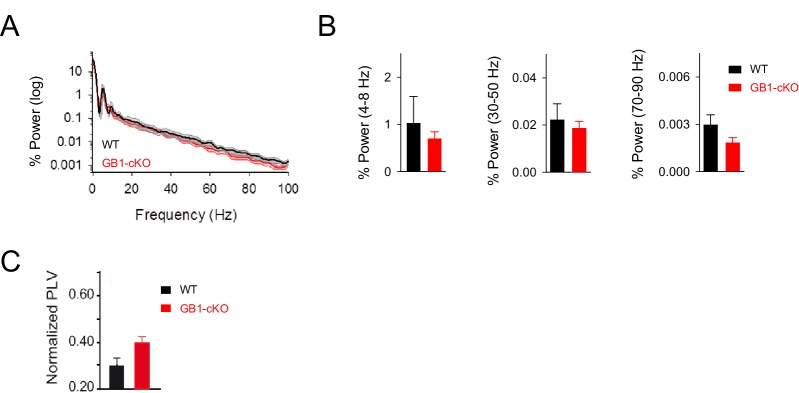
(A) Schematic illustration of the hippocampal recording configuration and whisker stimulation in anesthetized mice. (B) Representative LFP recordings and corresponding analysis of theta-phase and gamma-amplitude relation for control littermate (left) and GB1-cKO (right) mice. The raw signals (black) were high-pass filtered (1st row; grey and red, respectively) and then computed to extract the theta phase (second row) and gamma envelope (third row; grey and red, respectively) for control and GB1-cKO mice. (C) Normalized LFP power spectrum analysis for theta (4–8 Hz) and gamma frequencies (30–50 Hz, low gamma; 70–90 Hz, high gamma) in control littermate (n = 6) and GB1-cKO mice (n = 6) after whisker stimulation. Inset, Relative power changes for GB1-cKO and control littermate mice (theta band, p=0.007; unpaired t test; low gamma, p=0.042; Wilcoxon rank-sum test; and high gamma oscillations, p=0.738; Wilcoxon rank-sum test). (D) Gamma-amplitude modulation by theta-phase for wild-type (left) and GB1-cKO mice (right), before (control) and after whisker stimulation (post stim). Note the enhancement of theta-gamma coupling in wild-type after stimulus that does not appeared in GB1-cKO mice. (E) Normalized Phase-Lock Value (PLV), either in control and after stimulation for wild-type (p=0.017; paired t test), and GB1-cKO mice (p=0.62; paired t test). See also Figure 7—figure supplement 1. *p<.05; **p<0.01. .


