. 2016 Dec 21;5:e21848. doi: 10.7554/eLife.21848

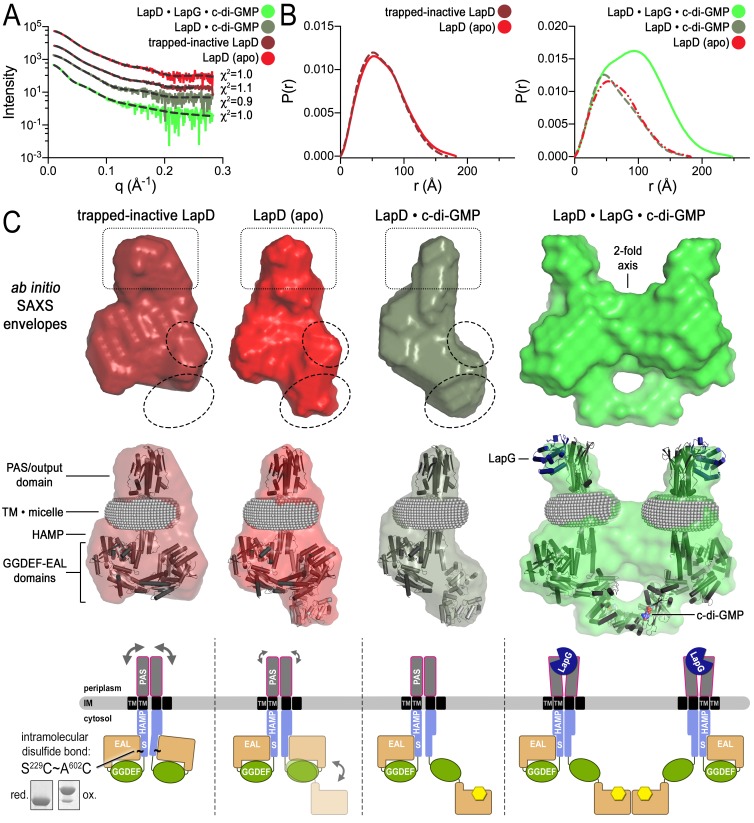
Figure 4. Modeling of SAXS data for distinct LapD states illustrates the conformational changes upon receptor activation.

(A) Primary SAXS data. Solid lines, experimental scattering curves of LapD in the states indicated; dashed lines, theoretical scattering curves of the three-dimensional envelopes shown in panel (C) with χ2 values listed to the right. (B) Real-space pair-wise distance distribution functions for each state of LapD. (C) Modeling of SAXS data. Top: Ab initio three-dimensional envelopes calculated on the basis of the experimental scattering data. Dotted circles and boxes highlight areas of density that change between different states. Middle: Crystal structures of individual domains of LapD docked manually into the envelopes depict interpretations of the ab initio envelope models. Gray spheres represent the detergent corona that surrounds the transmembrane domain. Bottom: Cartoon models of LapD domain movements in each state based on the SAXS data (bottom left inset: SDS-PAGE of purified trapped-inactive LapD used for SAXS analysis). Source files of SAXS data and envelope data are available in Figure 4—source data 2.

DOI: http://dx.doi.org/10.7554/eLife.21848.009

Figure 4—source data 1. Statistics associated with the analysis of LapD small-angle X-ray scattering data.
All analyses were performed using the indicated programs included in the ATSAS 2.7.1 software package (Petoukhov et al., 2012). Rg, radius of gyration; Dmax, maximal particle dimension; Porod volume, volume of scattering particle; NSD, normalized spatial discrepancy; Rflex and Rsigma, as previously defined (Tria et al., 2015).
DOI: 10.7554/eLife.21848.010
Figure 4—source data 2. SAXS data and envelope model files related to Figure 4.
The zip archive contains buffer-subtracted scattering raw data (folder ‘raw_data’, extension ‘.dat’) and GNOM files (folder ‘gnom_output’, extension ‘.out’) that contain original data, real space distance distribution functions, and associated statistics. The folder ‘damfilt_pdb’ contains the final files (extension ‘.pdb’) of the envelope modeling.
DOI: 10.7554/eLife.21848.011

Figure 4.

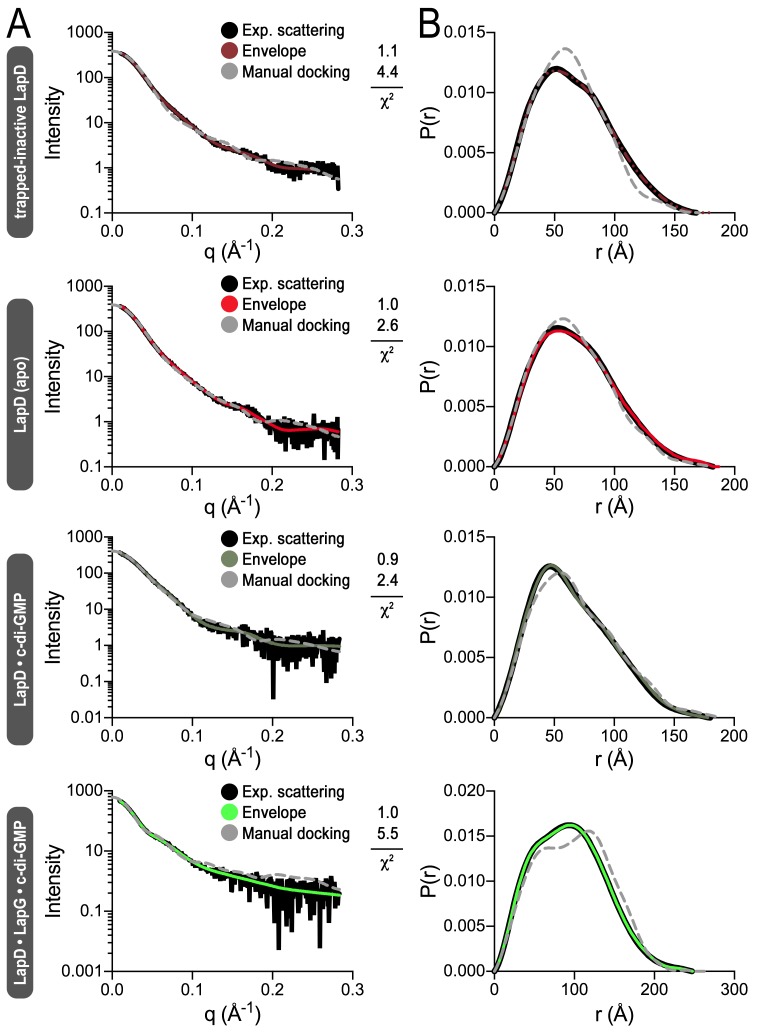
Figure 4—figure supplement 1. Fitting of various models to LapD small-angle X-ray scattering data.

Figure 4—figure supplement 1.

(A) Experimental scattering data for the indicated states of LapD (black lines) overlayed with theoretical scattering curves of models generated from envelopes (solid, colored lines) and manual dockings (dashed, grey lines) shown in Figure 4B, with their associated χ2 fit values. (B) Real-space distance distribution functions for these theoretical models of LapD overlayed on the experimentally derived distribution function (black).
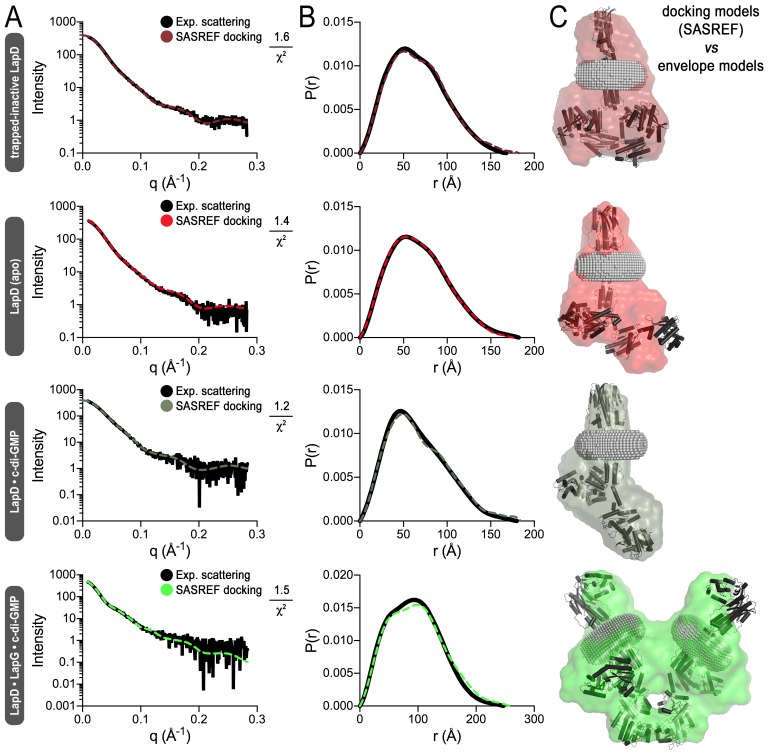
Figure 4—figure supplement 2. Simulated annealing and rigid-body fitting of crystal structures of individual LapD domains to full-length LapD small-angle X-ray scattering data.

Figure 4—figure supplement 2.

(A) Experimental scattering data of the indicated states of LapD (black lines) overlayed with theoretical scattering curves of these SASREF-generated models (dashed, colored lines), with their associated χ2 fit values. (B) Real-space distance distribution functions for these theoretical models of LapD overlayed on the experimentally derived distribution function (black). (C) Docking of the SASREF models for each LapD state into their respective three-dimensional envelopes shows reasonable agreement between the two independent analyses of the SAXS scattering data.
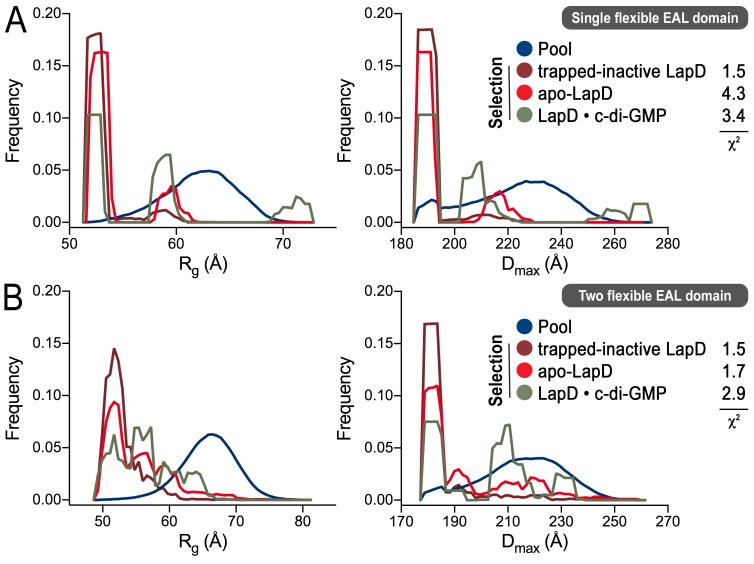
Figure 4—figure supplement 3. Ensemble optimization method (EOM) analysis of the LapD SAXS data.

Figure 4—figure supplement 3.

On the basis of the experimental SAXS data for three states (trapped-inactive, apo, and c-di-GMP-bound), ensembles of LapD conformations were selected from a random pool of 10,000 models with either one or two flexible EAL domains in a LapD dimer. While the χ2 fit values indicate imperfect modeling of the SAXS data by this approach (probably due to the constraints that we imposed on the global LapD conformation), there is a clear trend in selections for the three different states with regard to the Rg (left panels) and Dmax (right panels) distributions of the selected conformers, consistent with other experiments and analyses described in this report. (A) Selection from a pool generated with one EAL domain of a LapD dimer being flexibly linked to the GGDEF domain. (B) Selection from a pool generated with both EAL domains of a LapD dimer being flexibly linked to the GGDEF domain. See Material and methods for details and Figure 4—source data 1 for associated statistics.
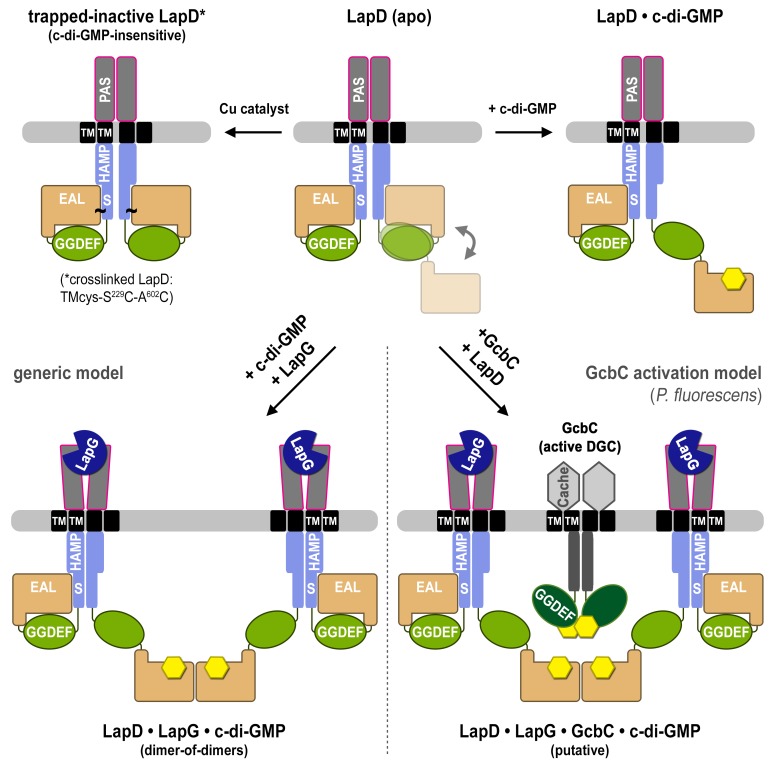
Figure 4—figure supplement 4. Proposed mechanism for activation of the LapD receptor.

Figure 4—figure supplement 4.

In the absence of c-di-GMP, apo LapD (top center) adopts a dynamic ‘half-open’ state, transiently exposing the nucleotide-binding site of one EAL domain, which can be occluded by locking the receptor in a c-di-GMP-insensitive autoinhibited state (top left; “trapped-inactive") by covalently crosslinking the S helix to the EAL domain (S229C ~ A602C). Upon binding of c-di-GMP to the native receptor’s accessible EAL domain, LapD adopts a more extended state (top right). Only when LapG and c-di-GMP bind the receptor together does LapD form dimer-of-dimers, for which the interface is mediated by EAL domain dimerization across two receptor dimers (bottom left). On the basis of recent findings that the diguanylate cyclase GcbC interacts with and specifically activates LapD (Dahlstrom et al., 2015, 2016), we hypothesize that activated LapD dimer-of-dimers may be stabilized by GcbC (bottom right) to ensure prolonged, high-affinity sequestration of LapG in the periplasm.