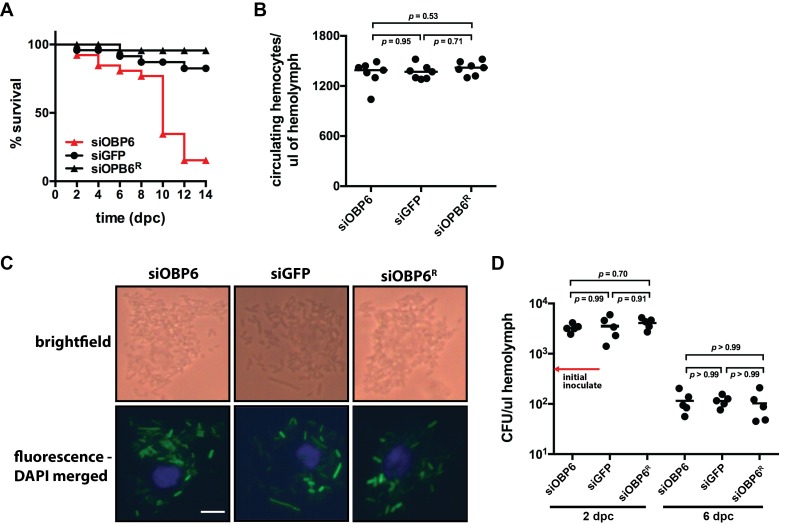
Figure 2. Tsetse odorant binding protein 6 does not mediate the development and function of phagocytic hemocytes.
(A) Survival following systemic challenge of siOBP6 and siGFP adults with 5 × 10² CFU of E. coli K12. Fly survival was monitored every other day for the duration of the 14 day experimental period. Survival assays were performed in triplicate, using 25 flies per replicate. Red curve depicts a statistically significant difference in infection outcome (p<0.0001, log-rank test). (B) Hemocyte abundance in siOBP6 and siGFP adults was quantified microscopically using a hemocytometer (Figure 2—source data 1). (C) A representative micrograph of hemocyte-engulfed recE. coliGFP from siOBP6, siGFP and siOBP6R adults. Experiment was performed using hemolymph collected from four distinct flies per (Figure 2—source data 2). Hemolymph was collected 12 hpc and fixed on glass slides using 2% paraformaldehyde. Magnification is x400. (D) E. coli densities (CFU/μl of hemolymph) in the hemolymph of siOBP6, siGFP and siOBP6R adults at 2 and 6 dpc (Figure 2—source data 3). In (B) and (D), symbols represent one hemolymph sample per group, and bars represent the median hemocyte quantity (B) or bacterial density (D) per sample. Statistical analysis = ANOVA followed by Tukey’s HSD post-hoc analysis.
DOI: http://dx.doi.org/10.7554/eLife.19535.006

