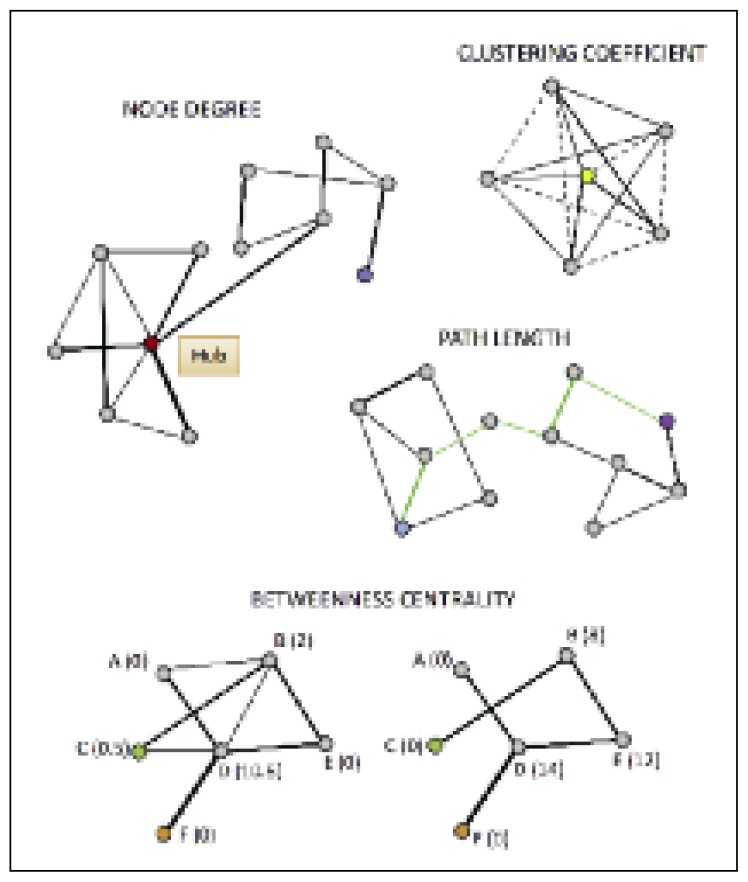
Figure 2.
Graphical representation of some graph indices.
Node degree: the red dot (node) represents a high degree node and it is directly connected with six out of 11 nodes; the blue dot represents a low degree node and it is directly connected with only one node. Clustering coefficient: quantification of the number of connections that exist between the nearest neighbors of the yellow node (continuous lines) as a proportion of the maximum number of its possible connections (dotted lines). Path length: the shortest connection between the light-blue and the purple nodes corresponds to the path length and is highlighted by green edges. Betweenness centrality: on the left, nodes A, B, C, D, E and F are well connected and maintain efficient network communication. Numbers in parentheses refer to each node’s betweenness centrality, which indicates how many of the shortest paths between all other node pairs in the network pass through it. To reach node C (green dot) from node F (orange dot), information flow is efficient and passes only through D. In the graph on the right, some connections have been lost. To reach C from F, information now has to go through more nodes (D, E and B).

