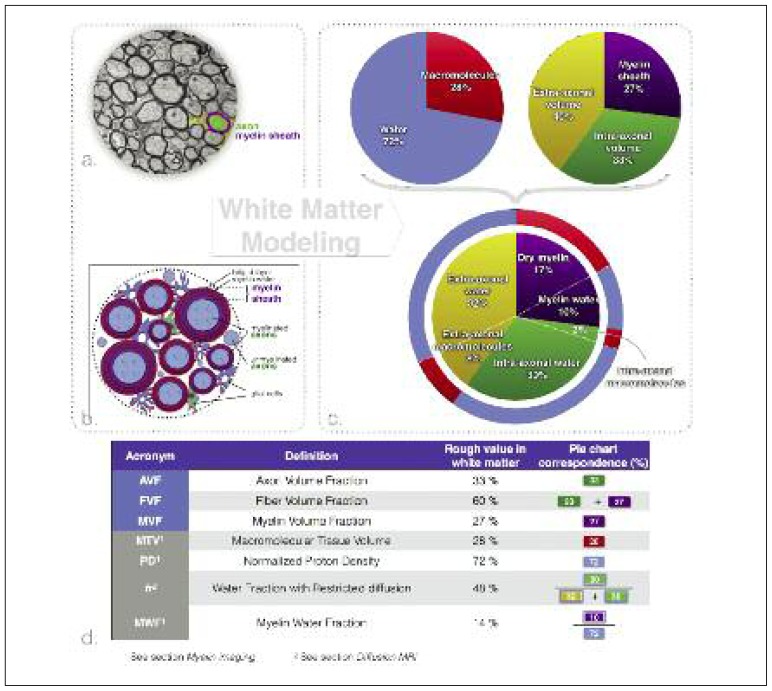
Figure 1.
Modeling of white matter tissue.
a. Transmission electron microscopy of an axial slice of white matter fiber bundles extracted from the corpus callosum of a mouse (West et al., 2016a). b. Schematic representation of the white matter. c. Proportions of the different white matter tissue components. The top left pie chart divides white matter into two general components: water (blue) (the component that produces the MRI signal) and lipids/macromolecules (red). The top right pie chart divides white matter into three spaces (used in diffusion and myelin imaging models): the myelin sheath (purple), the extra-axonal volume (yellow) and the intra-axonal volume (green). The bottom pie chart subdivides these three spaces into water and lipid/macromolecular content. d. Definitions of most commonly used MRI (gray boxes) and tissue modeling (light blue boxes) metrics and their rough values.

