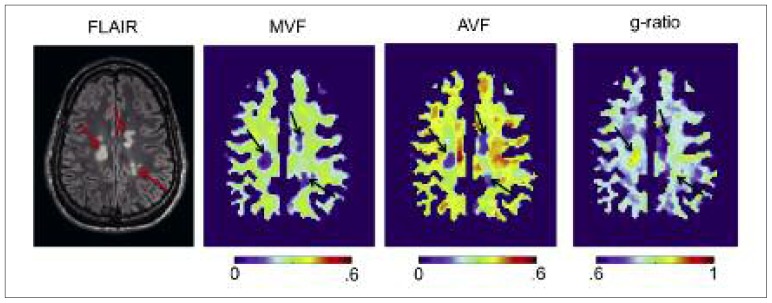
Figure 6.
Example of multi-parametric quantitative MRI maps of a multiple sclerosis patient.
Myelin volume fraction (MVF) was obtained using a qMT (Henkelman et al., 1993), axon volume fraction (AVF) was computed using the NODDI model (Zhang et al., 2012), and g-ratio was calculated from AVF and MVF (Stikov et al., 2015a). Conventional FLAIR contrast indicates the presence of three hyperintense lesions. These lesions are associated with a reduction in MVF and AVF, but only one lesion shows an abnormal g-ratio (>0.8).

