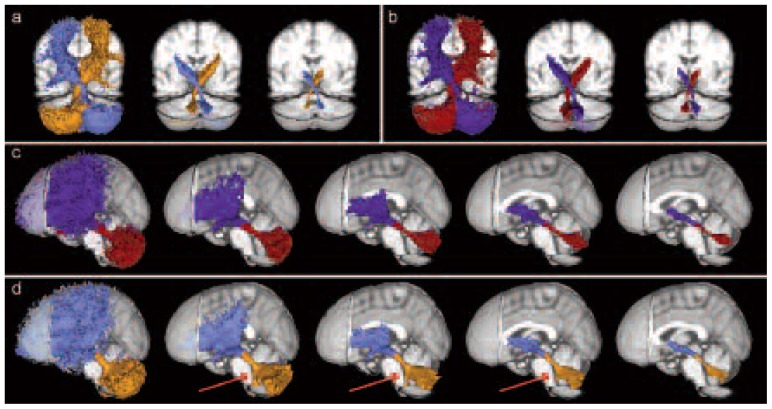
Figure 2.
Mean cerebello-thalamo-cortical pathways, across all subjects, at different thresholds of subjects.
Each tract is shown with a different color: left and right pathways are orange and light blue when b0 images were used, while they are red and blue when TDI maps were used. a) Detail of the decussation area for pathways reconstructed using ROIs on b0 images. Thresholds are (from left) equal to 0, 40 and 80% of subjects. b) Detail of the decussation area for pathways reconstructed using ROIs on TDI maps. Thresholds are (from left) equal to 0, 40 and 80% of subjects. c) Mean cerebello-thalamo-cortical pathways using ROIs on TDI maps. Thresholds are (from left) equal to 0, 20, 40, 60 and 80% of subjects. d) Mean cerebello-thalamo-cortical pathway using ROIs on b0 images. Thresholds are (from left) equal to 0, 20, 40, 60 and 80% of subjects. Red arrows indicate spino-cerebellar tracts.

